Dashboards overview
A dashboard is a saved arrangement of widgets over your KPIs, evaluated across one shared time range — Checkout Funnel Overview, Payment Quality and Failure Analysis.
Patterns and drivers exist to tell you when something is wrong. A dashboard is for the other half of the job: knowing what normal looks like, watching a number you have decided to care about, and answering a question you already know how to ask.
Dashboards live under Dashboards, scoped to one use case.
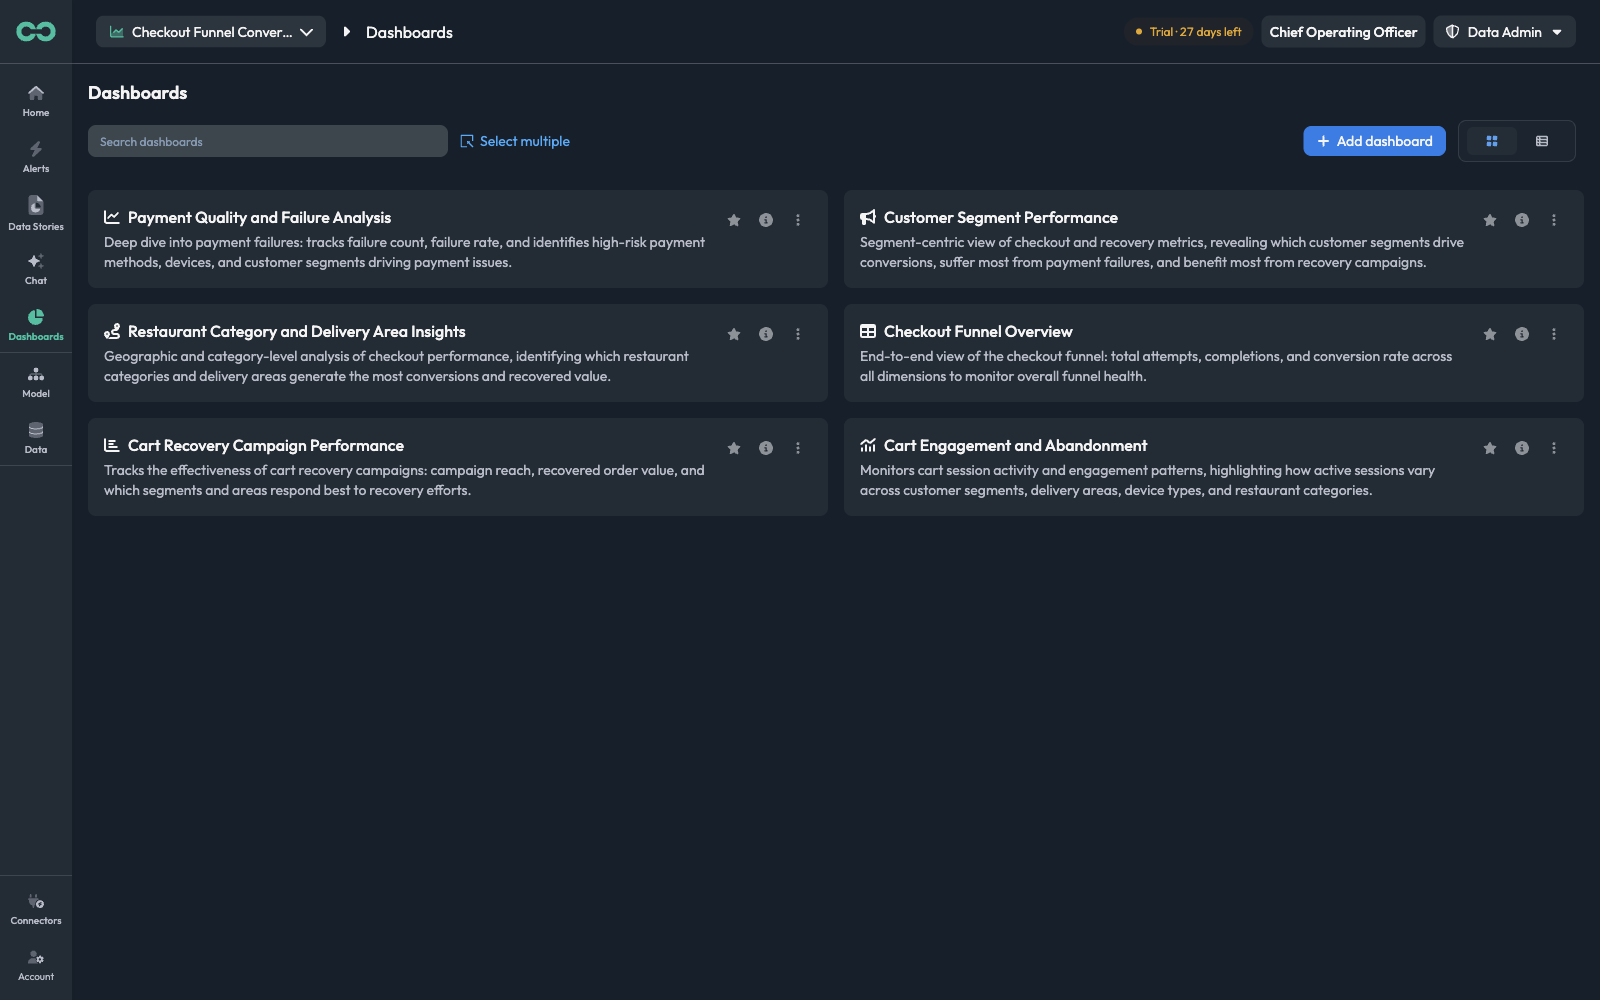
| Control | What it does |
|---|---|
| Search dashboards | Filters the list by name |
| Select multiple | Enables bulk selection across dashboards |
| + Add dashboard | Opens the Create dashboard modal — see Create a dashboard |
| Grid / list toggle | Switches between the card grid and a compact table |
| Card icons | Star to favourite, info for the description, kebab for the per-dashboard menu |
Reading a dashboard
Opening one shows the widgets, all resolved against the same time range.
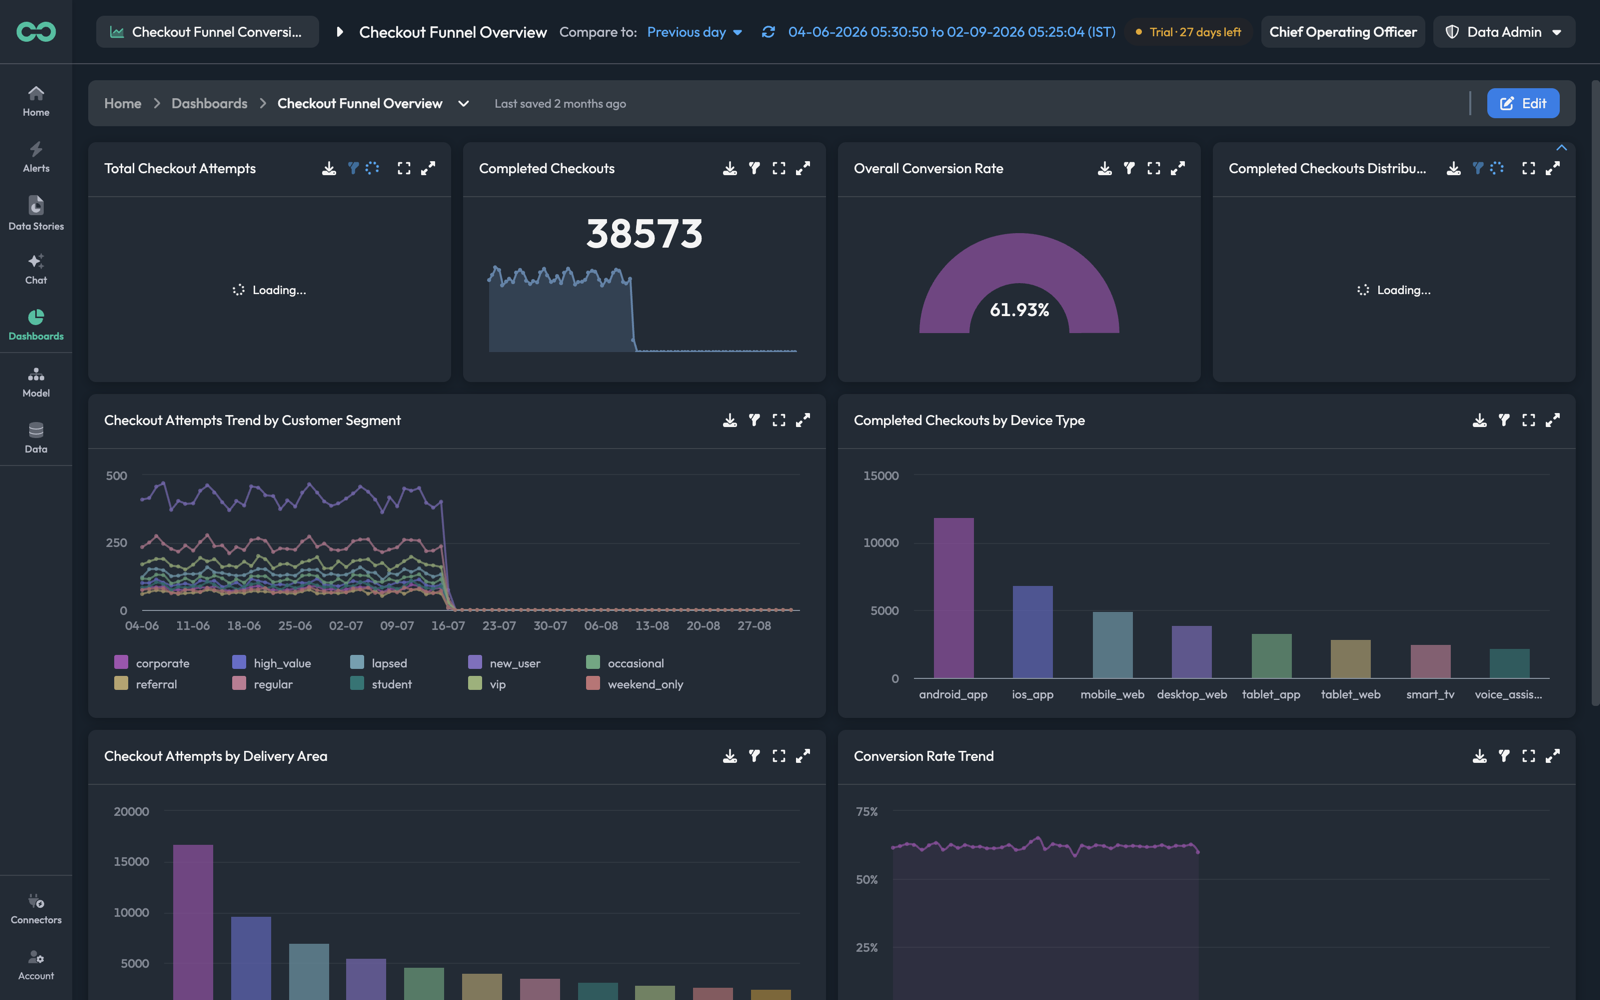
Three things in the header shape everything below it:
Time rangeThe window every widget is evaluated over, shown in full in the top bar — 04-06-2026 05:30:50 to 02-09-2026 05:25:04 (IST). Click it to change the window; the refresh icon beside it re-runs the queries.
Compare toThe baseline period each widget is measured against — Previous day and the other offsets. This is what produces the change indicators; it does not change the window itself.
Last savedWhen the layout was last written, beside the breadcrumb. Widgets always show live data — this timestamp is about the arrangement, not the numbers.
Every widget inherits the dashboard's range unless it overrides it. A widget can be pinned to its own window in the widget editor — see Widget time range — which is how a dashboard shows "today" and "trailing 90 days" side by side.
Widget controls
Hovering a widget reveals its toolbar in the header:
| Icon | What it does |
|---|---|
| Download | Exports the widget's data |
| Filter | Applies a filter to this widget only |
| Fullscreen | Expands the widget to fill the view |
| Expand | Opens the widget larger in place, for charts with many series |
In edit mode each widget gains a kebab menu and a drag handle in its bottom-right corner for resizing.
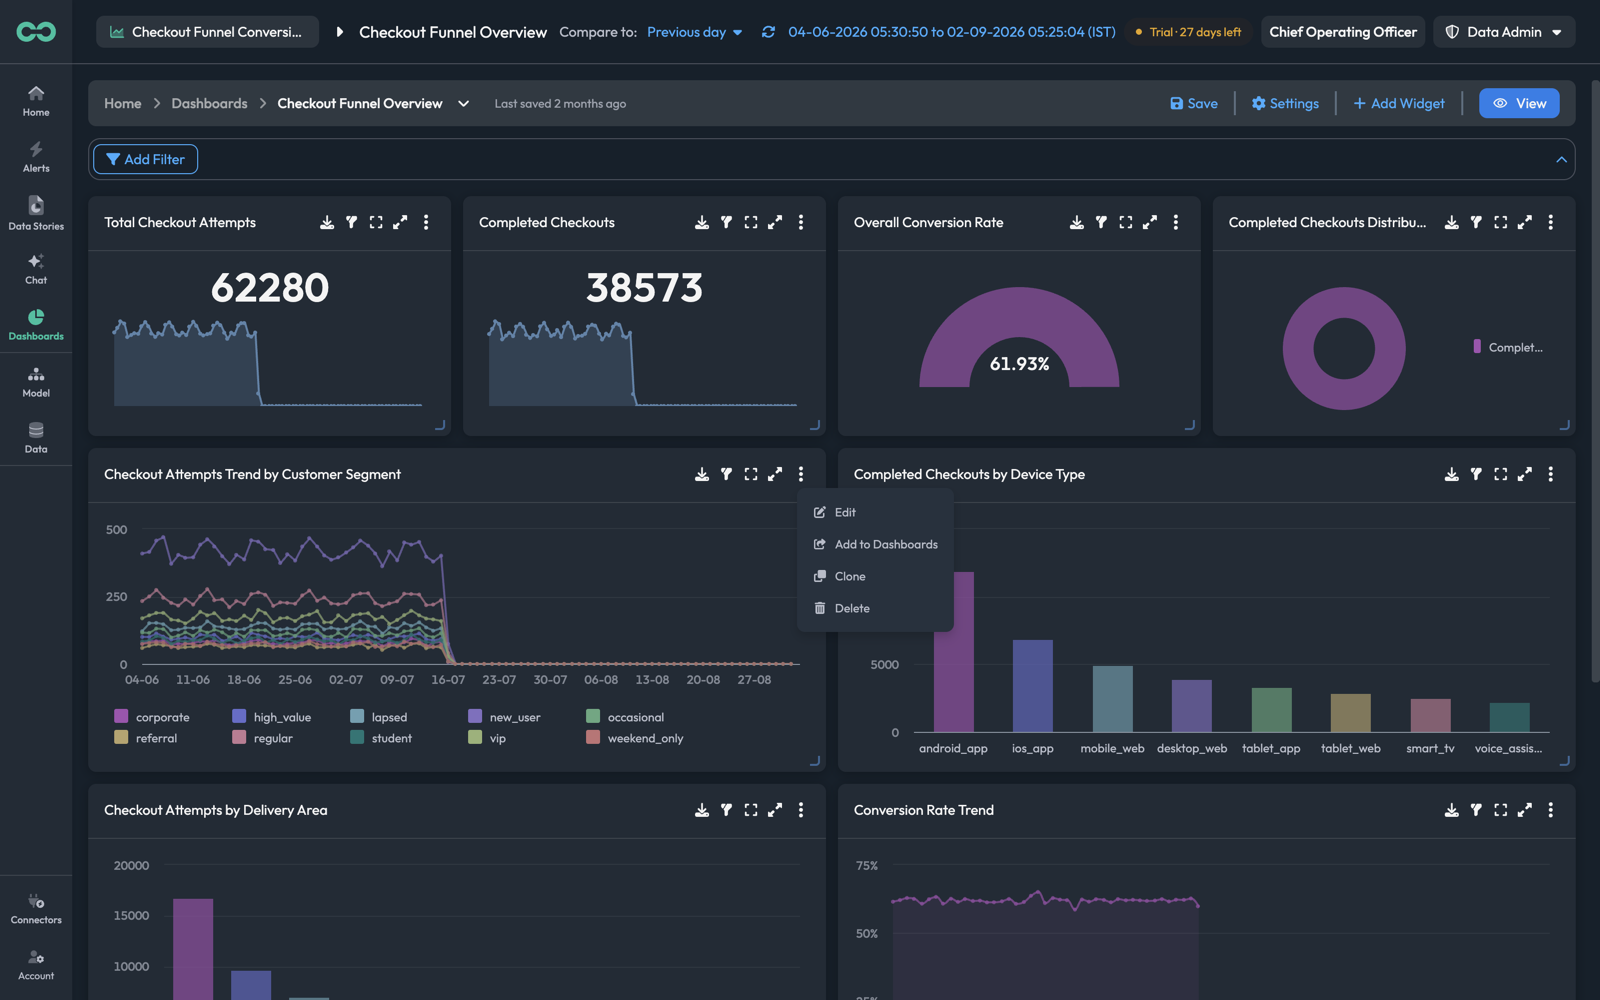
Add to Dashboards is the one worth knowing about: it copies a widget onto another dashboard without rebuilding its query. When two teams want the same chart in different contexts, build it once and add it twice.
Widget types
Bicycle offers nine, and the Add Widget modal splits them into a popular set and the full list.
| Widget | Use it for |
|---|---|
| Stat | A single number, no chart |
| Scorecard | A number with its trend and change against the comparison period |
| Line Chart | A metric over time, one line per dimension value |
| Bar chart | A metric compared across the values of a dimension |
| Donut | Composition — how a total splits across a few values |
| Gauge | One value against a range, such as a rate against a target |
| Tree map | Composition with many values, where relative size is the point |
| Table | Exact numbers across several dimensions |
| Raw events | The underlying events themselves, unaggregated |
The choice between Stat and Scorecard is worth a moment. A stat answers what is it; a scorecard answers what is it, and is that better or worse than last period — and the second question is nearly always the one being asked.
Core concepts
WidgetOne visualization on the dashboard. A widget renders one or more series and has its own type, breakdowns, filters, and optional time range.
SeriesOne measurement inside a widget, built on a KPI. A widget can hold several — a line chart comparing attempts against completions is two series.
BreakdownHow a series is split. By dimension produces one line or bar per dimension value; by time buckets the series into intervals.
Dashboard filterA filter applied across the whole dashboard, added from the Add Filter bar in edit mode. Distinct from a widget filter, which affects one widget.
ComparisonThe baseline period set by Compare to, used to compute each widget's change indicators.
Where to go next
- Create a dashboard — from a prompt or by hand, and the widget editor field by field
- KPIs — defining the metrics a widget charts
- Chat — asking a one-off question instead of building a dashboard for it