Create a data story
From Data Stories, + Add data story creates a definition; a story's kebab → Edit reopens one. Both use the same five-step wizard, with Back and Next to move between steps and Update to save.
| Step | What you set |
|---|---|
| 1. Define | The name, the description, and the system prompt the analysis runs against |
| 2. Workflow | Review the stages Bicycle generated from your definition |
| 3. Story output | Report, slides, or both — and how much of the structure to control |
| 4. Input variables | The parameters each run takes |
| 5. Subscription | Schedules and recipients |
A Chat panel sits to the right throughout, so you can ask the agent to adjust the definition rather than editing every field by hand.
1. Define
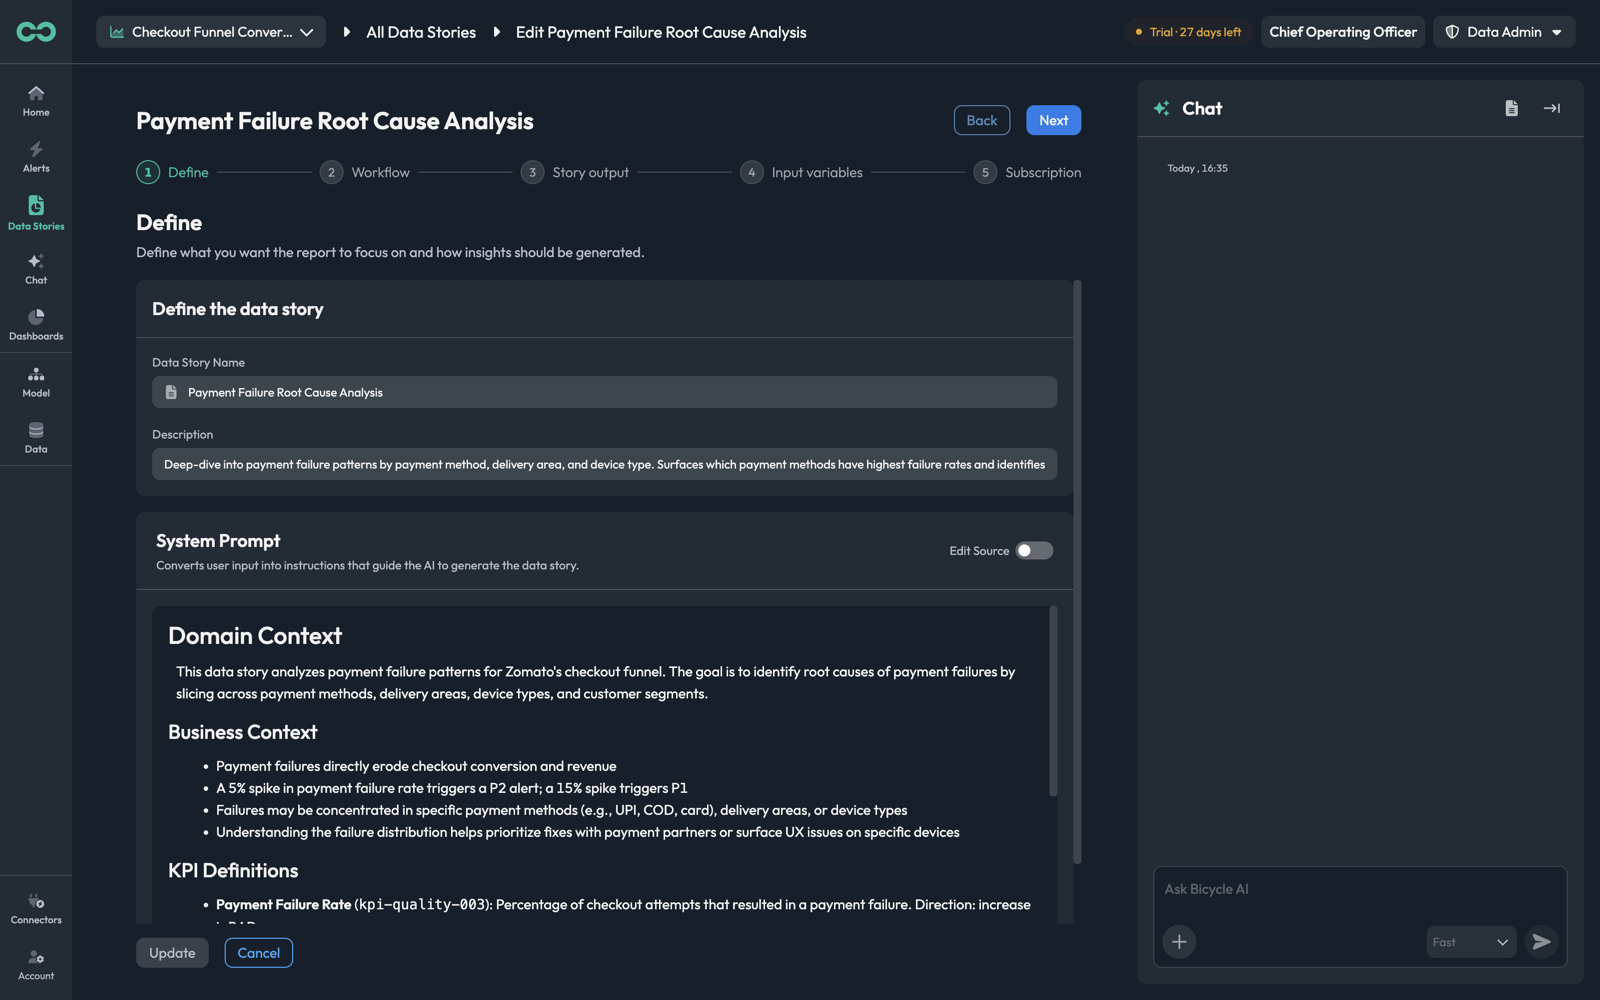
Data Story NameWhat the story is called on its card and in the subject of the emails it sends.
DescriptionWhat the analysis investigates, in one or two sentences. This is what someone reads when choosing which story to run.
System PromptThe domain knowledge the analysis runs against, in Markdown. The Edit Source toggle switches between the rendered view and the raw source.
Writing the system prompt
This field is the story. Everything downstream — which queries run, what counts as significant, what the report says — follows from it, and the generated stories all use the same four-part structure:
Domain Context
What this story analyses and what it is for. "This data story analyses payment failure patterns for the checkout funnel. The goal is to identify root causes of payment failures by slicing across payment methods, delivery areas, device types, and customer segments."
Business Context
Why it matters and where the thresholds are — the judgement an analyst on your team would bring. "A 5% spike in payment failure rate triggers a P2 alert; a 15% spike triggers P1."
KPI Definitions
The metrics by name and id, with what each measures and which direction is bad. "Payment Failure Rate (kpi-quality-003): percentage of checkout attempts that resulted in a payment failure. Direction: increase is BAD."
Key Dimensions
The exact field names to slice by, with what each is for. "payment_method_name: segments by payment method — primary breakdown for failure root cause."
Two parts of that carry more weight than they look:
- Direction. Without it the analysis cannot tell a good movement from a bad one. A rising conversion rate and a rising failure rate are both "up".
- Exact dimension names. The prompt notes where they come from — "exact names from
event_summaries". A dimension named approximately is a run that fails on an invalid dimension, which is a visible failure mode on the Runs tab.
"Payment failures erode conversion" tells the analysis what to look at. "A 5% spike is P2, 15% is P1" tells it what to call urgent. The second is what makes a report actionable instead of merely descriptive.
2. Workflow
Bicycle generates the execution logic from your definition and shows it for review.
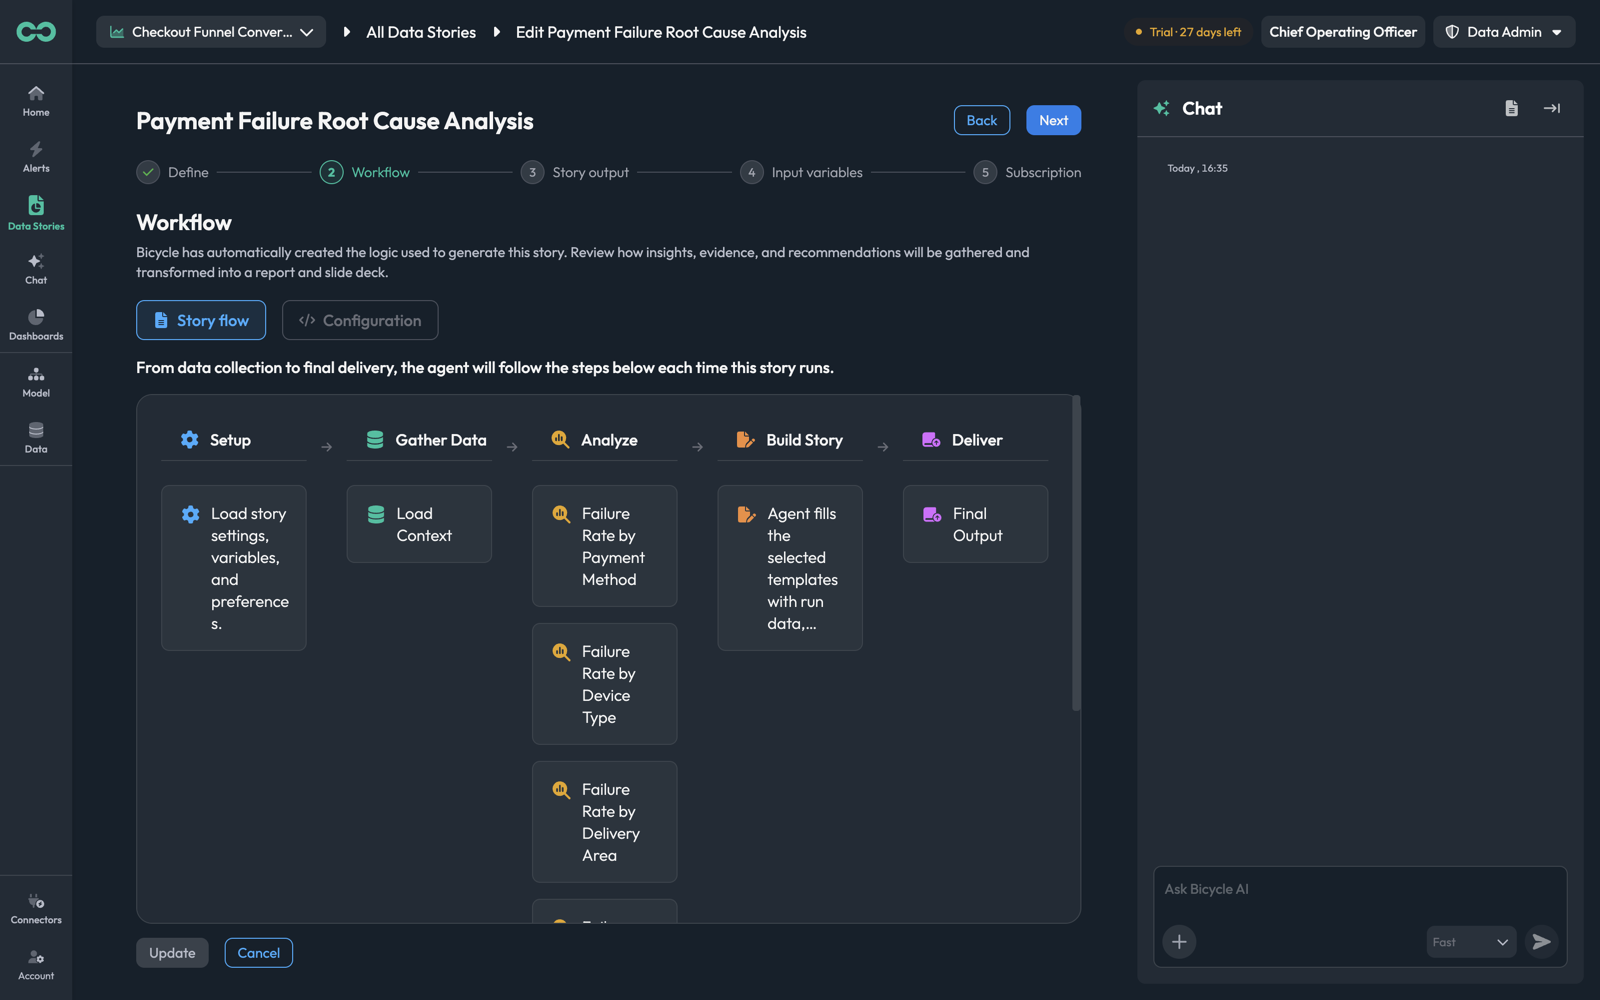
The Story flow tab lays out the stages every run works through:
| Stage | What happens |
|---|---|
| Setup | Loads story settings, variables, and preferences |
| Gather Data | Loads context — the schema, KPI availability, and model |
| Analyze | Runs one analysis per angle in your definition — Failure Rate by Payment Method, by Device Type, by Delivery Area, by Customer Segment, Root Cause Investigation, External Factors |
| Build Story | Fills the selected output templates with the run's findings, honouring audience, tone, and length preferences |
| Deliver | Produces the final output |
The Analyze column is the one to read. Each card is an angle derived from your system prompt, so it is the direct check on whether the prompt said what you meant: an angle you expected and cannot see is a gap in the prompt, and one you did not ask for is a sentence to tighten.
Configuration
The Configuration tab shows the same logic in its underlying form: a Files tree — Execution Workflow / skill.md — and the pipeline definition itself, with its own Edit Source toggle.
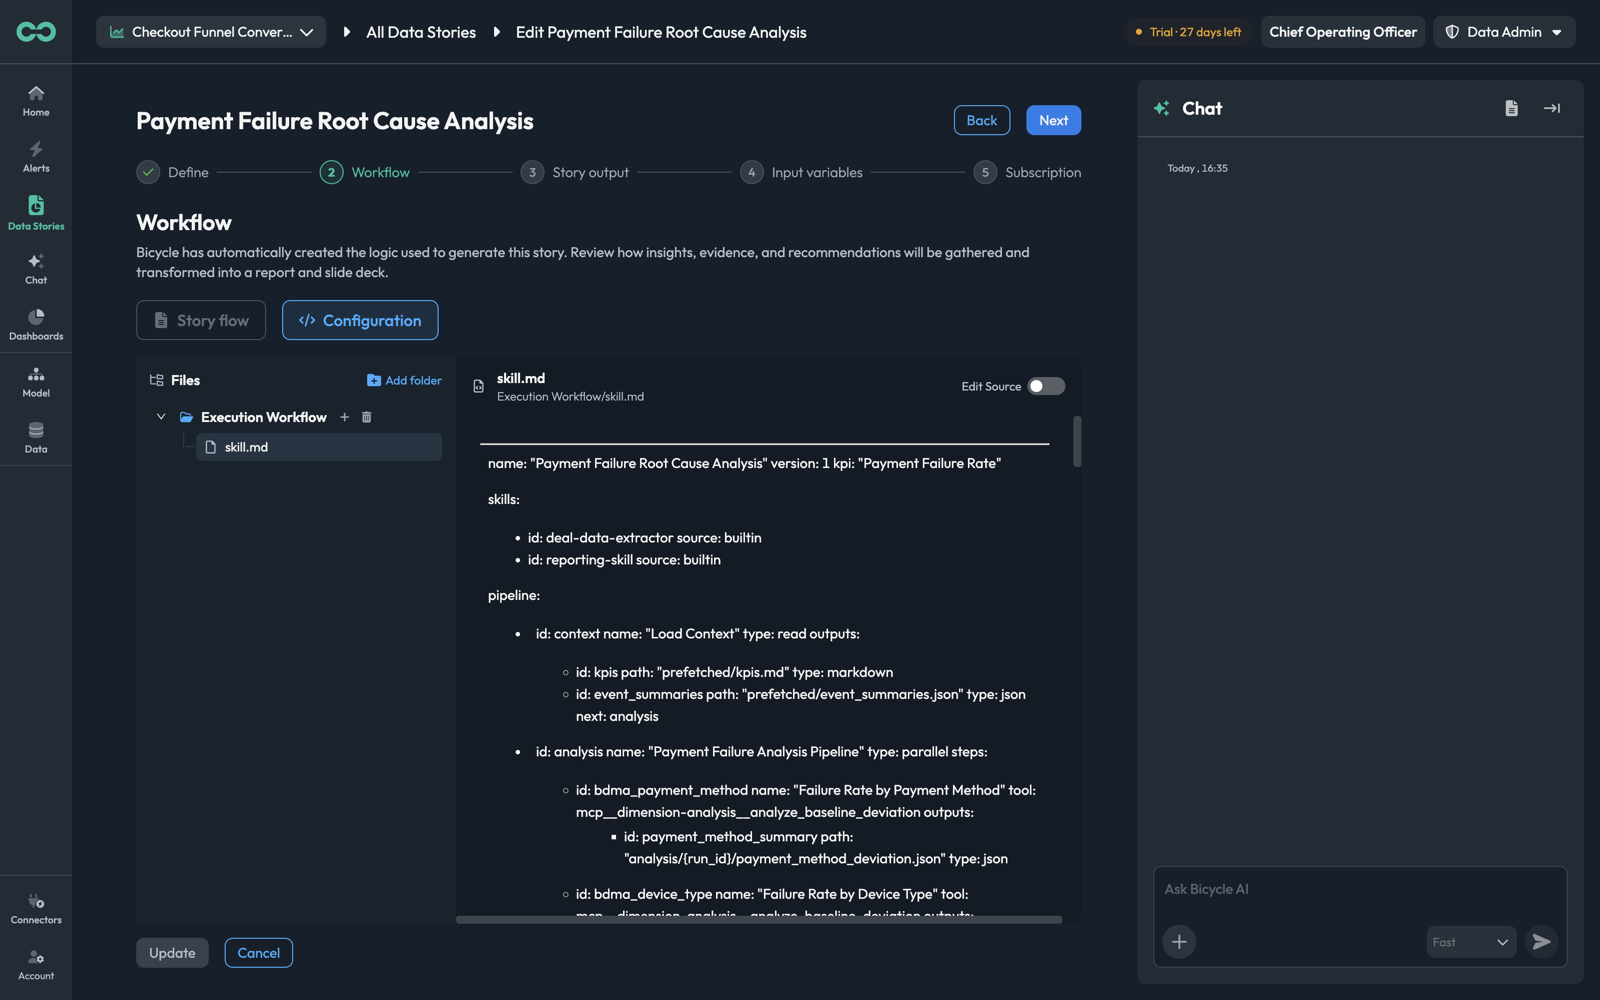
The file declares the story's name, the KPI it centres on, the skills it uses, and then the pipeline: each step's id, name, the tool it invokes, and where its output is written. The Analyze cards from the Story flow tab appear here as the parallel steps they actually are.
This is the exact definition, so it is where to look when a run does something you cannot explain from the visual flow — and it is editable, which makes it the escape hatch for a step the generated logic got subtly wrong. Prefer asking the Chat panel to make the change; editing the pipeline by hand means owning it afterwards.
3. Story output
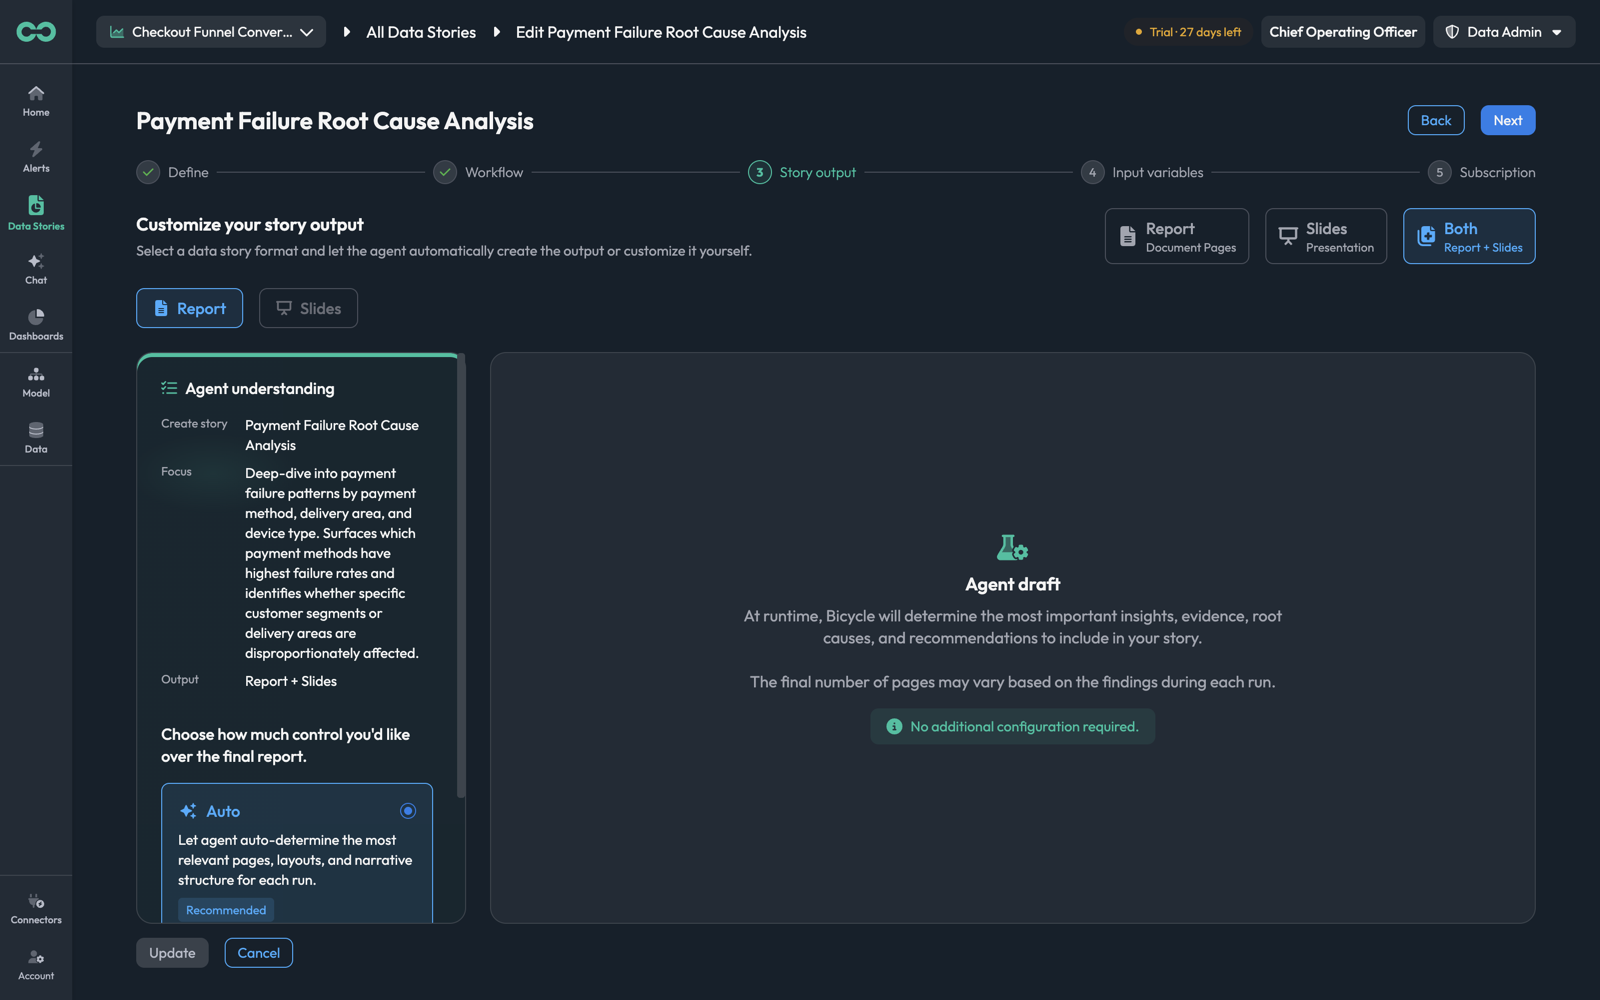
First choose the format — Report (Document Pages), Slides (Presentation), or Both (Report + Slides). With Both selected, the Report and Slides sub-tabs configure each independently.
The Agent understanding panel on the left plays your definition back — what story is being created, its focus, and the chosen output. Read it as a check on step 1: if the focus does not match what you intended, fix the prompt rather than working around it here.
Then choose how much structure to control:
AutoDefault: RecommendedThe agent determines the most relevant pages, layouts, and narrative structure for each run. Page count varies with what the run finds.
CustomYou define the structure, page templates, and page count yourself.
Auto is recommended and is right for most stories, for a specific reason: a fixed page count forces every run into the same shape, so a quiet week gets padded and a bad week gets truncated. Reach for Custom when the output has to match a format someone else owns — a board pack, a standing review deck.
4. Input variables
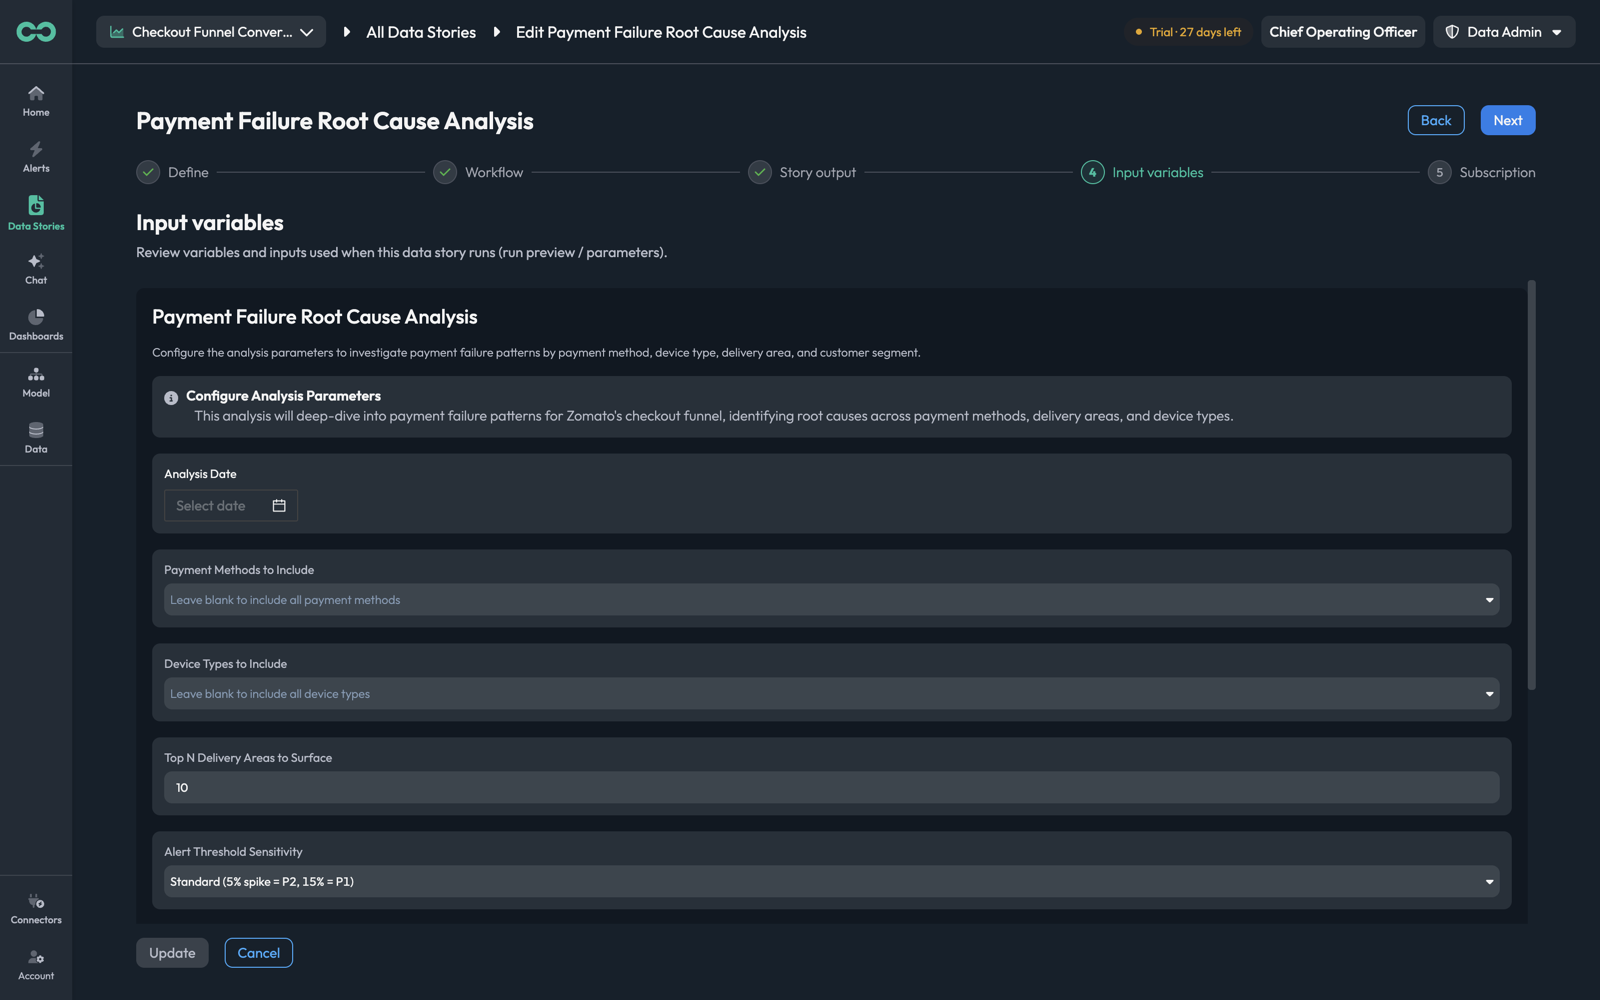
These are the parameters a run takes, and they are what make one definition reusable. For the payment-failure story:
| Parameter | What it controls |
|---|---|
| Analysis Date | The period the run analyses |
| Payment Methods to Include | Narrows the population — blank includes all |
| Device Types to Include | The same, for devices |
| Top N Delivery Areas to Surface | How many areas the report calls out |
| Alert Threshold Sensitivity | Which thresholds classify a finding — Standard (5% spike = P2, 15% = P1) |
| Include External Research | Whether to look outside your data for gateway outages and news |
Below them, Analysis Coverage lists what the run will do with those parameters — the breakdowns it will produce and what each compares against.
Note the pattern in the optional filters: "Leave blank to include all payment methods." Blank means everything, not nothing. Fill them in only to narrow a run deliberately.
This step defines the parameters and their defaults. The values for a particular execution are set when you run it — see Run and subscribe. A subscription supplies them on every scheduled run.
5. Subscription
The last step manages delivery: schedules and recipients for this story.
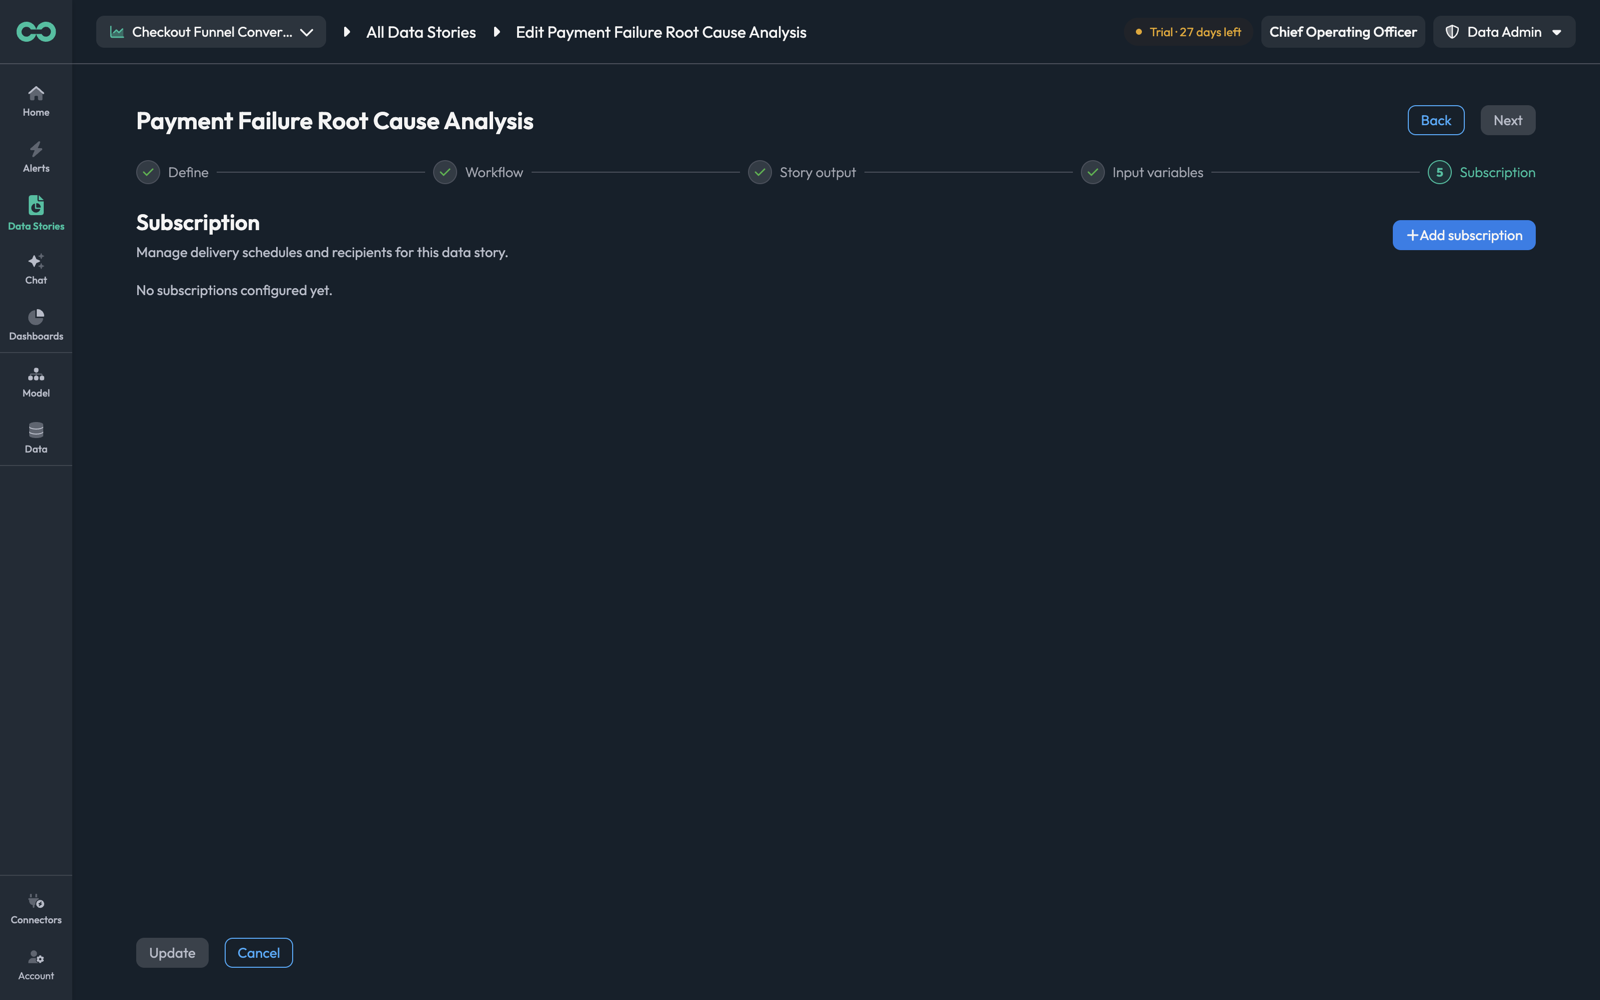
A definition with none reads "No subscriptions configured yet" and runs only when someone clicks Run New.
Add subscription is covered in full under Subscriptions.
Update saves the definition.
Things to know
- The system prompt is the whole story. The workflow, the analysis angles, and the report structure are all derived from it. Time spent there pays back everywhere; time spent adjusting the output around a vague prompt does not.
- Name dimensions exactly. An approximate field name produces a run that fails on an invalid dimension, and the failure surfaces in the headline rather than as an error at save time.
- State direction for every KPI. Without "increase is BAD" the analysis cannot rank findings by severity.
- Clone a working story to make a similar one. The prompt structure and parameter set are the expensive parts, and cloning keeps both.
- Use the Chat panel for edits you can describe. Asking for another breakdown dimension is faster than editing the prompt and re-checking the generated workflow by hand.
Next: Run and subscribe — executing a story and scheduling it.