Create a driver
From Model → Drivers, click + Add. The Add Driver page is one screen: identity at the top, then three panels that map onto the three questions a driver answers.
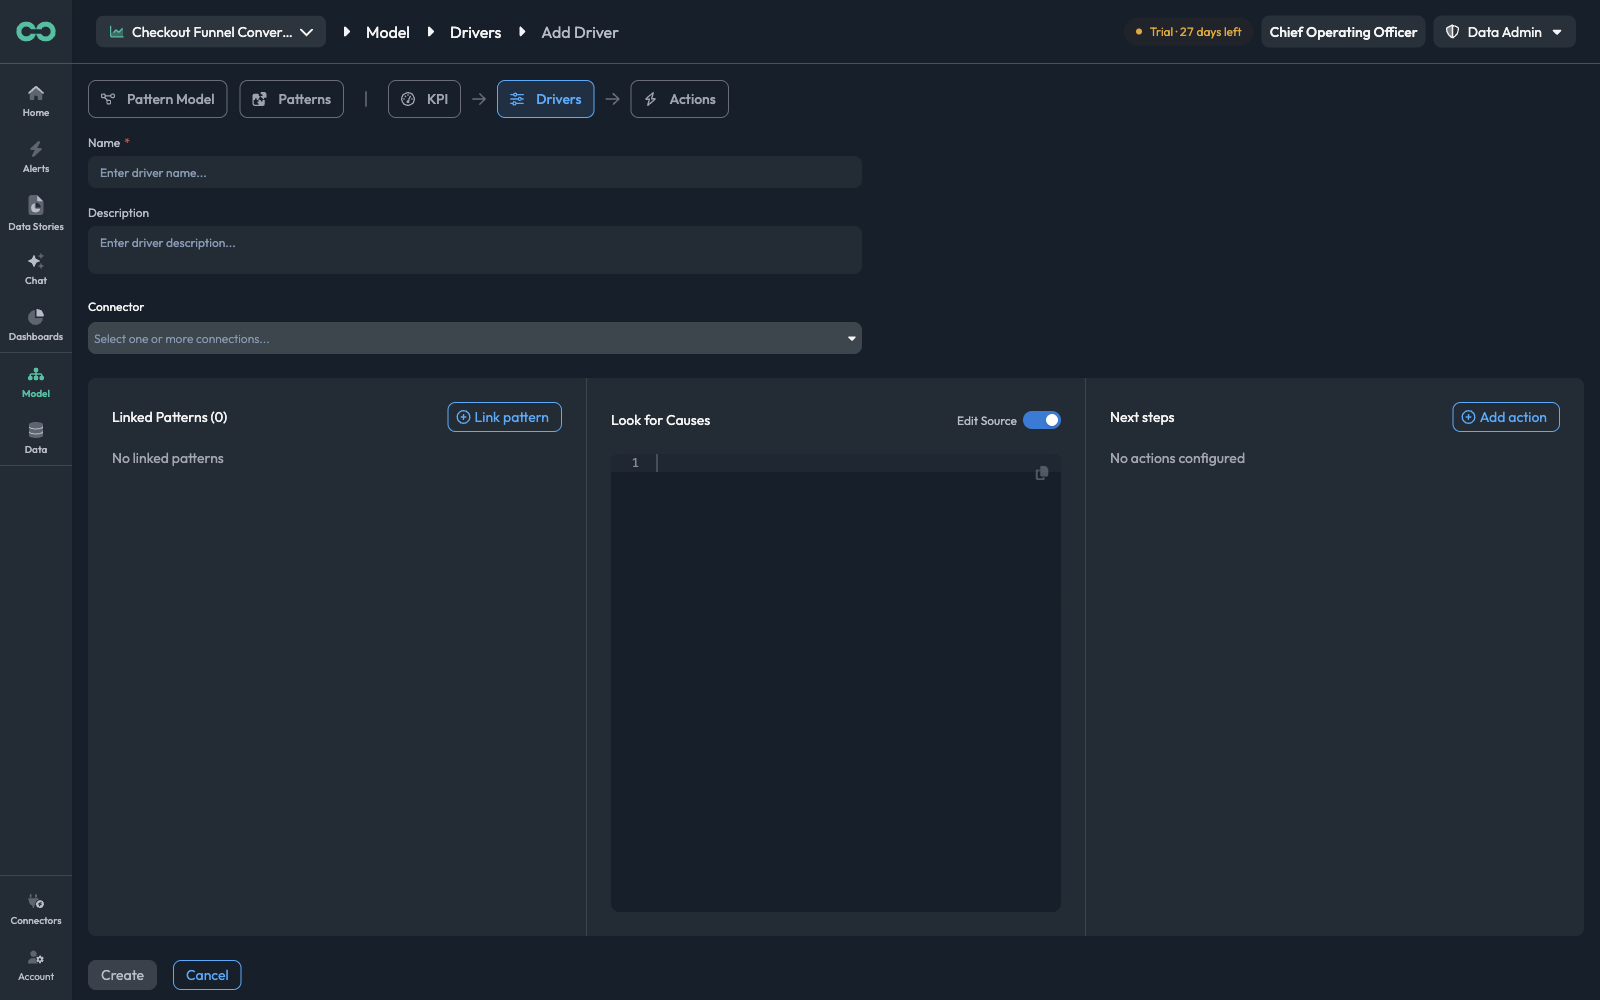
| Panel | The question it answers |
|---|---|
| Linked Patterns | When should this cause be considered? |
| Look for Causes | What might have happened, and how would we know? |
| Next steps | What should happen once it is confirmed? |
Only Name is required to click Create. A driver with nothing else filled in is inert, though — the sections below are in the order worth filling them.
1. Name and description
NameRequiredThe name of the cause, as it will read in an investigation and in the pattern's linked-driver list. Name the area of failure, not the symptom: Payment Gateway Health, not Checkouts dropped.
DescriptionWhat this driver investigates. This is read by the investigation, not just by people, so be specific about the scope — which failures it covers and which KPIs they affect.
A description that earns its place reads like the boundary of the driver:
Investigates payment method-level failures, gateway timeouts, and authorization declines that reduce completed checkouts and inflate payment failure rates on the checkout funnel.
That tells the investigation both what to consider this driver for and, by omission, what not to.
2. Connector
The tools this driver may query for evidence. It is a multi-select over your existing connections, so one driver can draw on several — an error tracker, an APM, a product-analytics tool, and your source control.
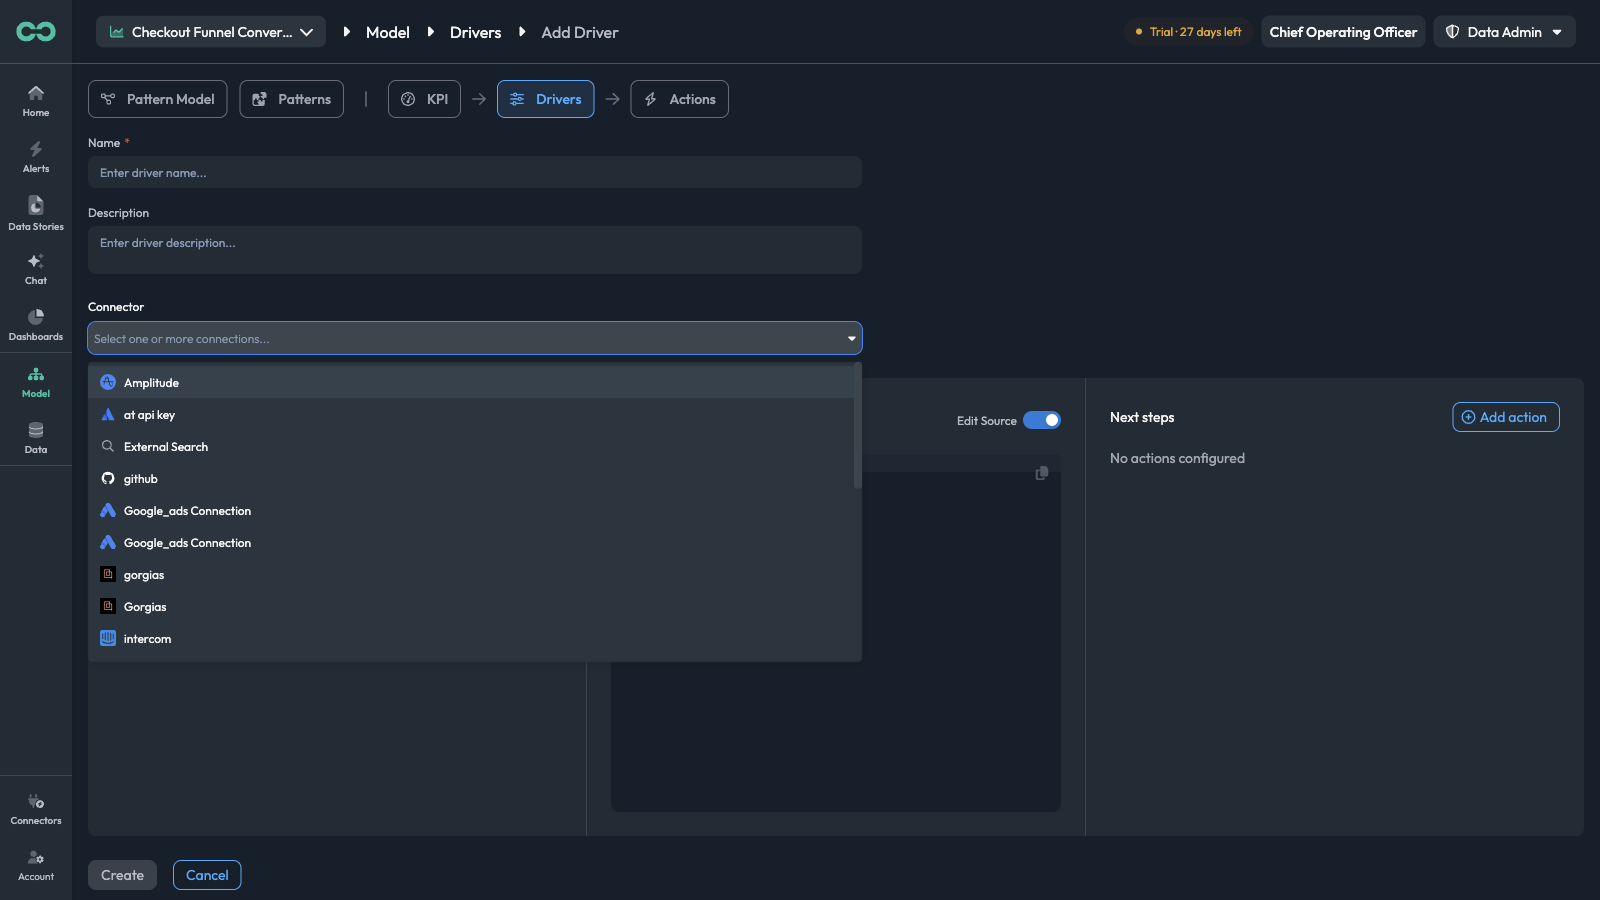
Pick every tool a hypothesis in this driver actually names. A step that says "Query Sentry for crash rates" needs Sentry selected here; without it the step has nothing to run against.
This dropdown lists connections that already exist. To add a new tool, set it up under Connectors first — see Connectors Available.
3. Linked patterns
Link pattern opens a panel listing every pattern in the use case, with a search box and a checkbox on each.
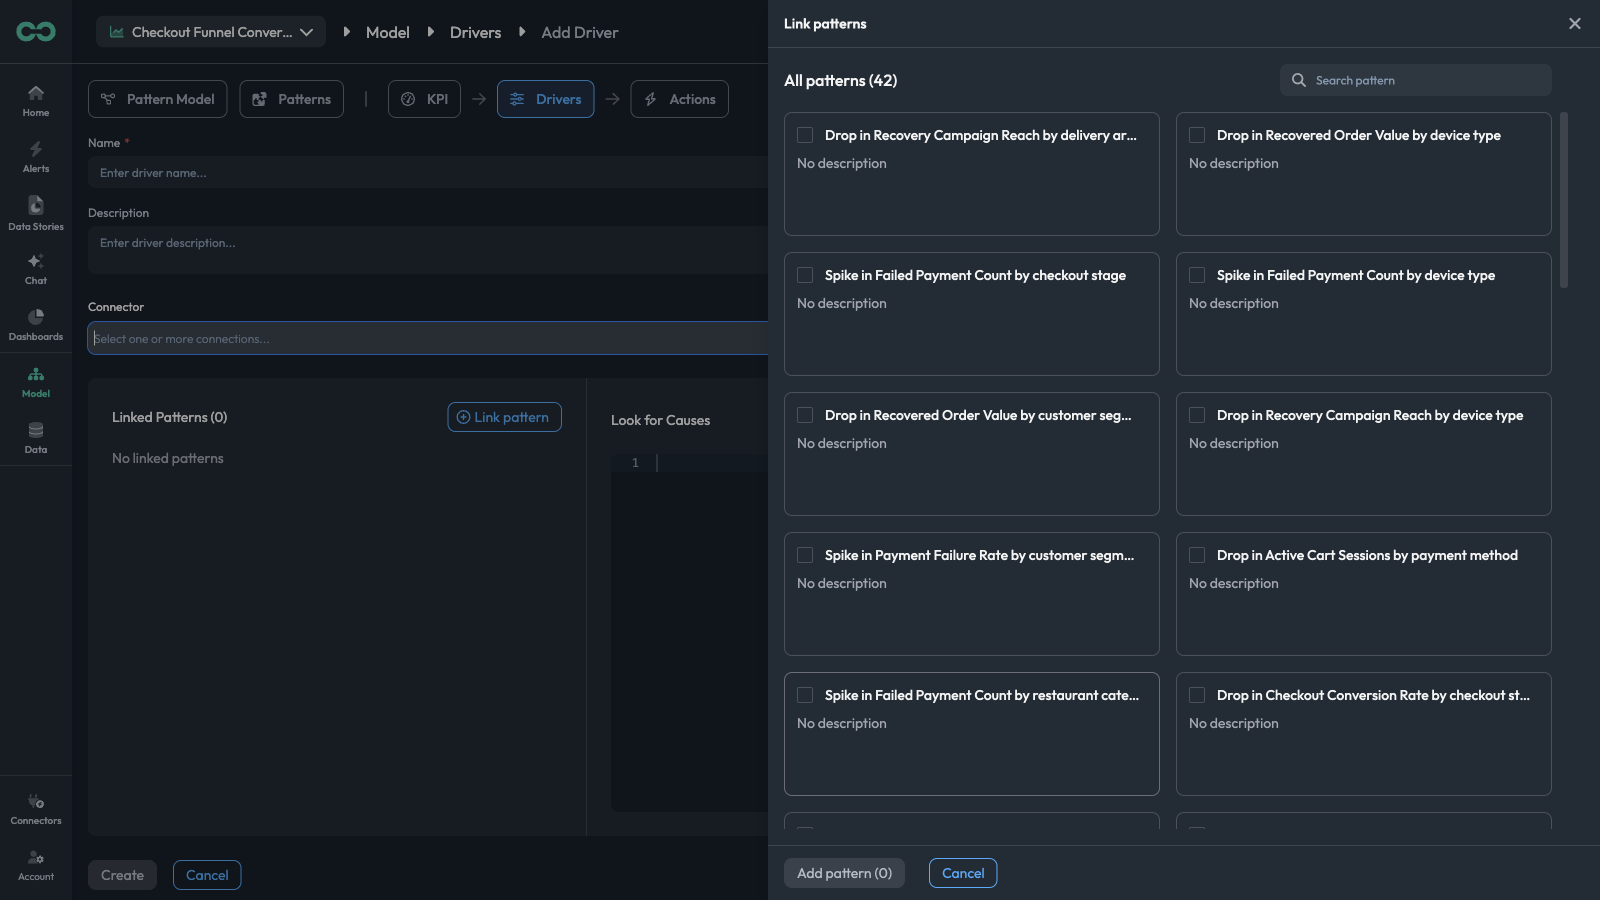
Select the patterns this driver is a plausible explanation for, then Add pattern (N). The panel header shows the total available — All patterns (42) — and the button counts your selection.
Link generously along one dimension and narrowly across others. A Payment Gateway Health driver belongs on every pattern sliced by payment method — the drops, the spikes, and the rate patterns alike — because a gateway problem shows up in all of them. It does not belong on patterns sliced by delivery area, where it would be considered and ruled out on every run for nothing.
A pattern's Explain & Act tab has a Link driver control that creates the same relationship from the other side. Use whichever direction matches what you are doing — wiring one driver to many patterns here, or one pattern to a few drivers there. See Explain & Act.
4. Look for Causes
This is the substance of the driver: the hypotheses, and how to test each one.
The field is Markdown. The Edit Source toggle switches between the rendered view and the raw source, and the format is exactly two levels:
##— one heading per hypothesis-— one bullet per investigation step under it
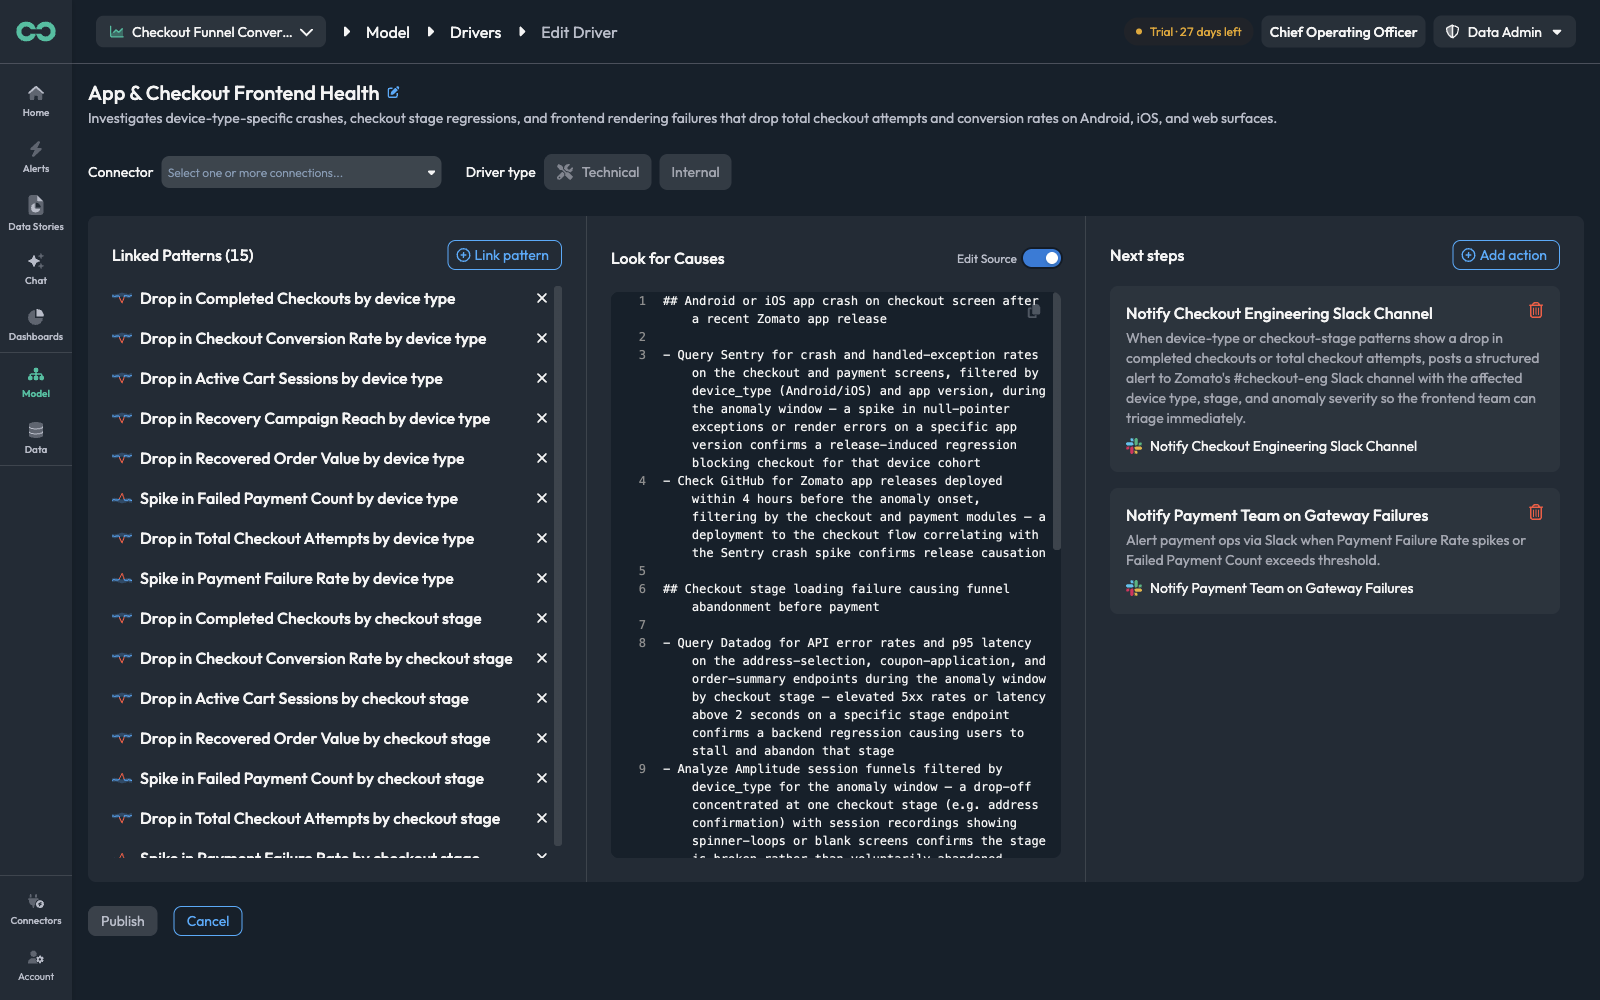
Toggle Edit Source off to read it back the way the investigation sees it:
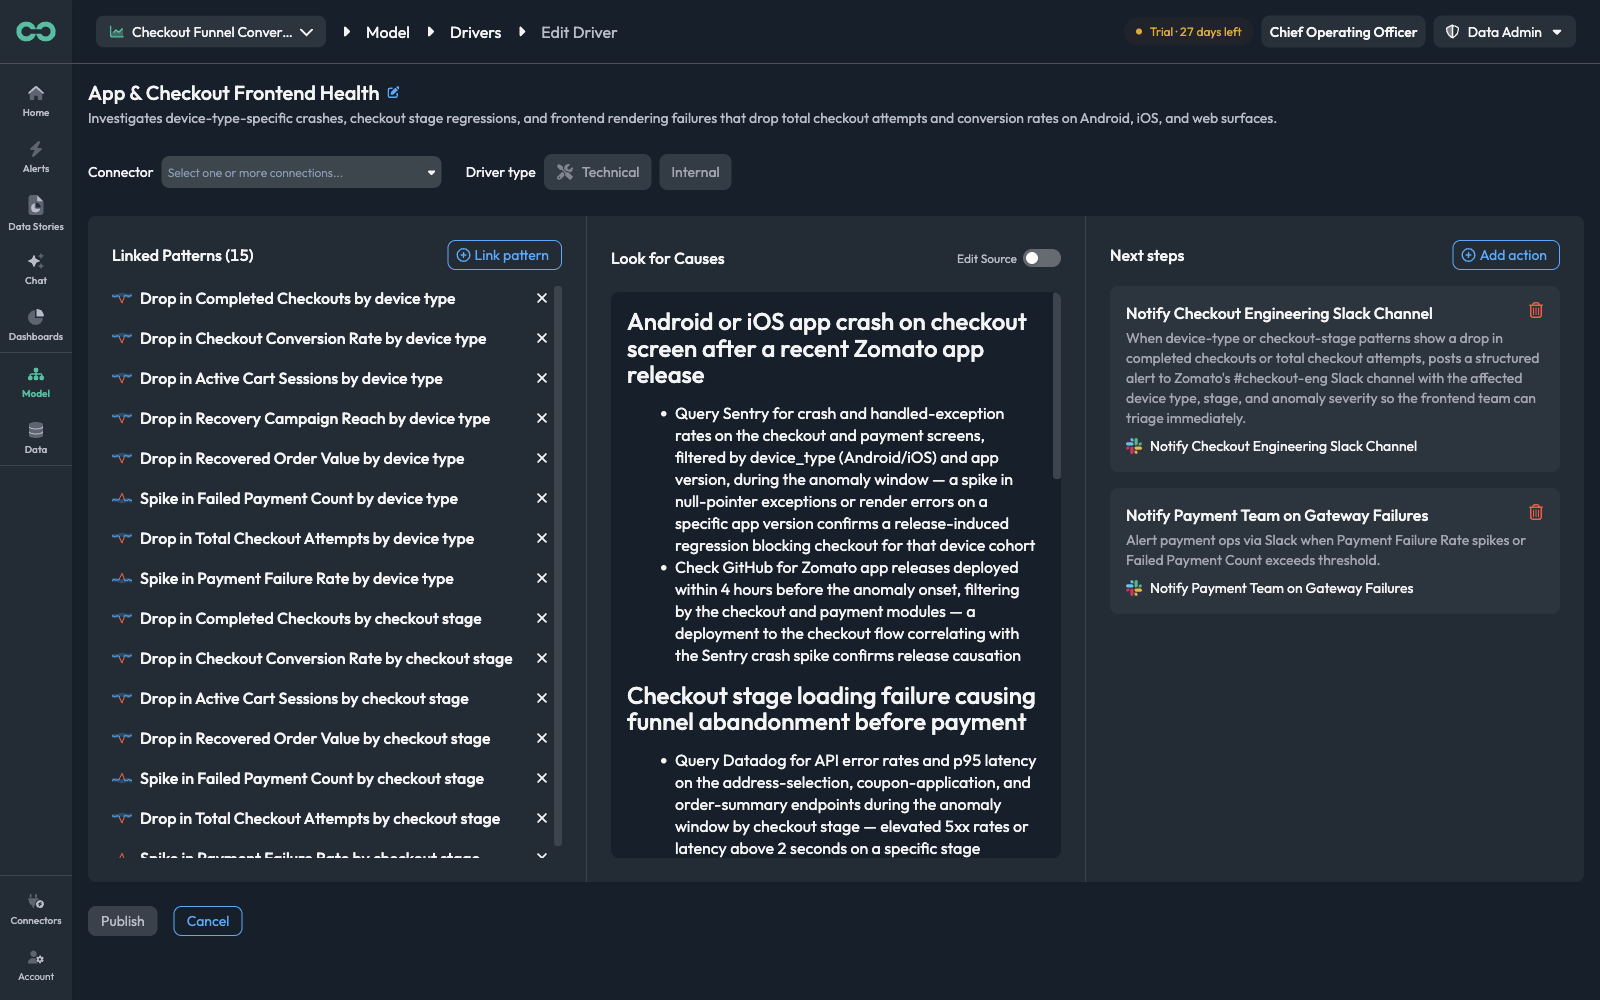
Writing a hypothesis
A hypothesis heading is a complete, falsifiable claim about a mechanism — not a topic.
| Instead of | Write |
|---|---|
## Crashes | ## Android or iOS app crash on checkout screen after a recent app release |
## Backend | ## Checkout stage loading failure causing funnel abandonment before payment |
## Mobile web | ## WebView or PWA rendering failure reducing checkout attempts on mobile web |
The difference is that the second column can be wrong. "Crashes" cannot be confirmed or ruled out; "an app crash on the checkout screen after a recent release" can — and that is what the investigation is trying to do.
Writing an investigation step
Each bullet under a hypothesis is one check, and a good one carries four things:
Which tool, and what to look at
Name the connector and the specific signal. "Query Sentry for crash and handled-exception rates on the checkout and payment screens."
How to filter it
The fields that make the check comparable to the anomaly. "...filtered by device_type (Android/iOS) and app version..."
Over what window
Almost always the anomaly window, sometimes a lead time before it. "...during the anomaly window", or "...deployed within 4 hours before the anomaly onset."
What result would confirm it
The decisive part, and the one most often left out. "— a spike in null-pointer exceptions on a specific app version confirms a release-induced regression blocking checkout for that device cohort."
Put together, one step reads:
Check GitHub for app releases deployed within 4 hours before the anomaly onset, filtering by the checkout and payment modules — a deployment to the checkout flow correlating with the Sentry crash spike confirms release causation.
Notice that the confirmation criterion refers to the previous step's finding. Steps under one hypothesis are allowed to build on each other, and the strongest evidence usually comes from two independent tools agreeing.
A step that only says what confirms a hypothesis leaves the investigation to guess at silence. Where the absence of a signal is meaningful, say so — "no deployment in that window rules out a release regression" — and the investigation can discard the hypothesis instead of reporting it as unresolved.
5. Next steps
Add action opens a panel of the actions already defined in this use case, with search and checkboxes.
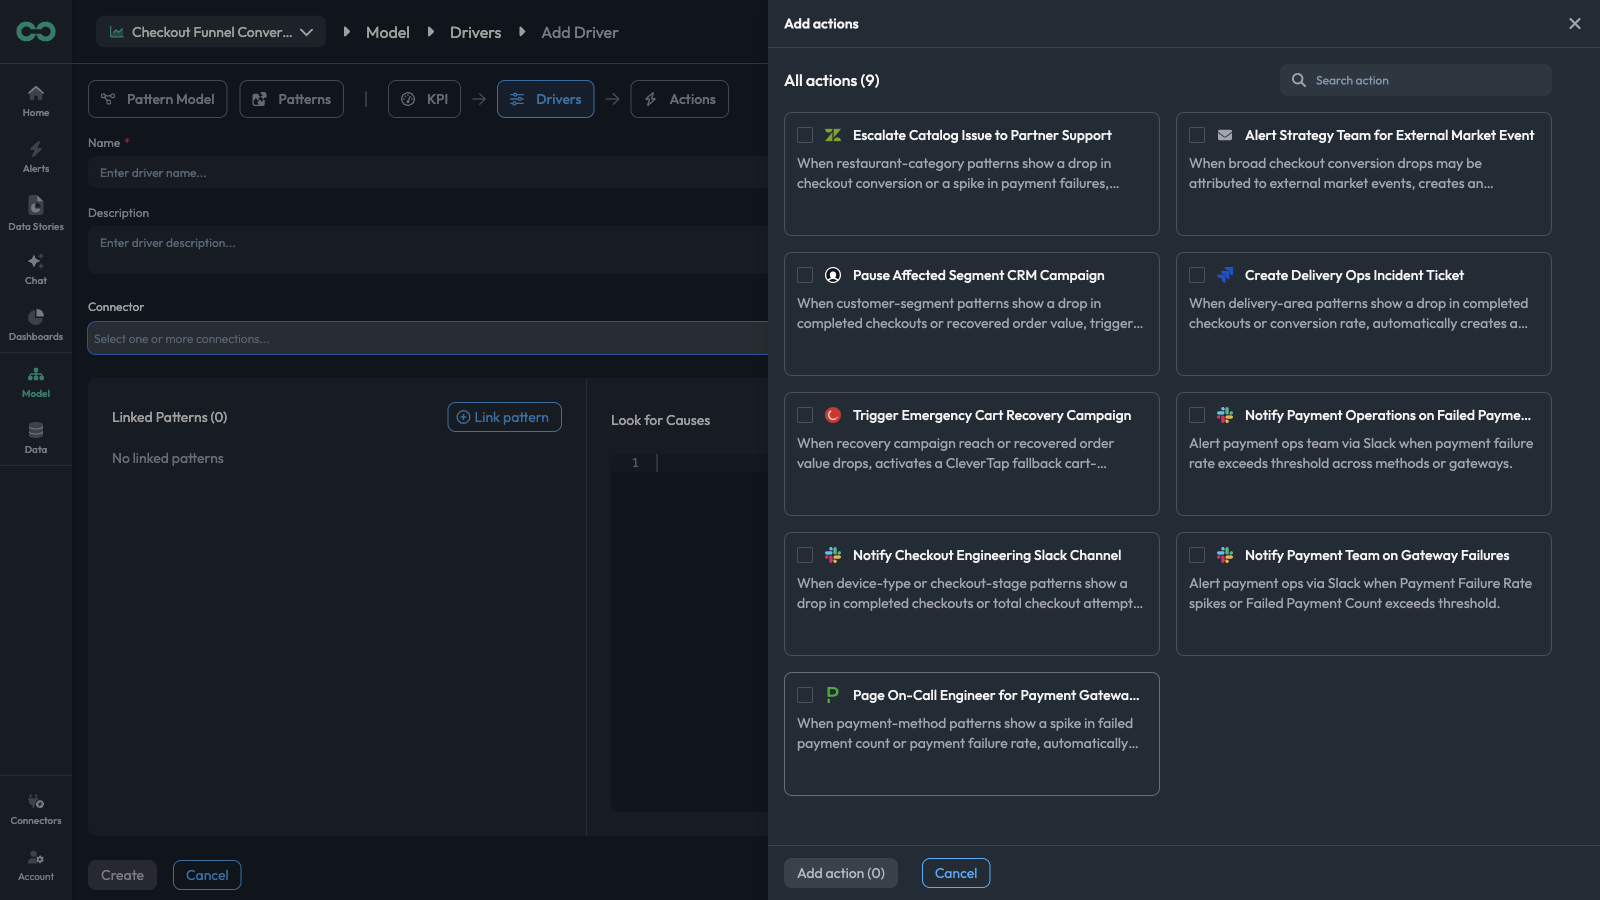
Select the ones that should fire when this driver is confirmed, then Add action (N). Each attached action appears in the Next steps panel as a card showing its name, what it does, and the connector it runs through, with a delete icon to detach it.
Attach only actions whose trigger condition genuinely matches the driver. The action's own description states that condition — "When device-type or checkout-stage patterns show a drop in completed checkouts... posts a structured alert to the #checkout-eng Slack channel" — and the closer it matches the driver's scope, the fewer false pages your team gets.
This panel only attaches actions that already exist. To create one — pick its connector, its tool, and its parameters — go to Model → Actions. See Create an action.
6. Save
Create saves a new driver and returns you to the list.
Editing an existing driver is the same form with two differences: the name and description move into the page header (with a pencil to edit them), the Driver type labels appear beside the connector, and the save button reads Publish rather than Create.
Things to know
- A driver with no linked patterns never runs. Nothing will ask it for an explanation. This is the most common reason a carefully written driver appears to do nothing.
- A step naming a connector you did not select cannot run. The Connector field and the tools named in Look for Causes have to agree; there is no error if they do not, the step simply finds nothing.
- Hypothesis order is a priority signal. Put the explanations you expect most often first.
- One driver, one area of failure. A driver that covers the app, the payment gateway, and the delivery network will be considered for every anomaly and will rarely be conclusive. Split it.
- Start from a recommendation when one fits. Recommended drivers come pre-written against your real KPI and dimension names, which is the fiddly part to get right by hand. See Recommended drivers.
Next: Actions — defining the responses a driver fires.