Create a KPI manually
From Model → KPI, click + Add, then + Add KPI manually below the OR divider in the modal.
The editor opens as two panes: the definition on the left, the Live preview on the right. Its title tracks the name you give the KPI, so it starts as Add KPI - New KPI.
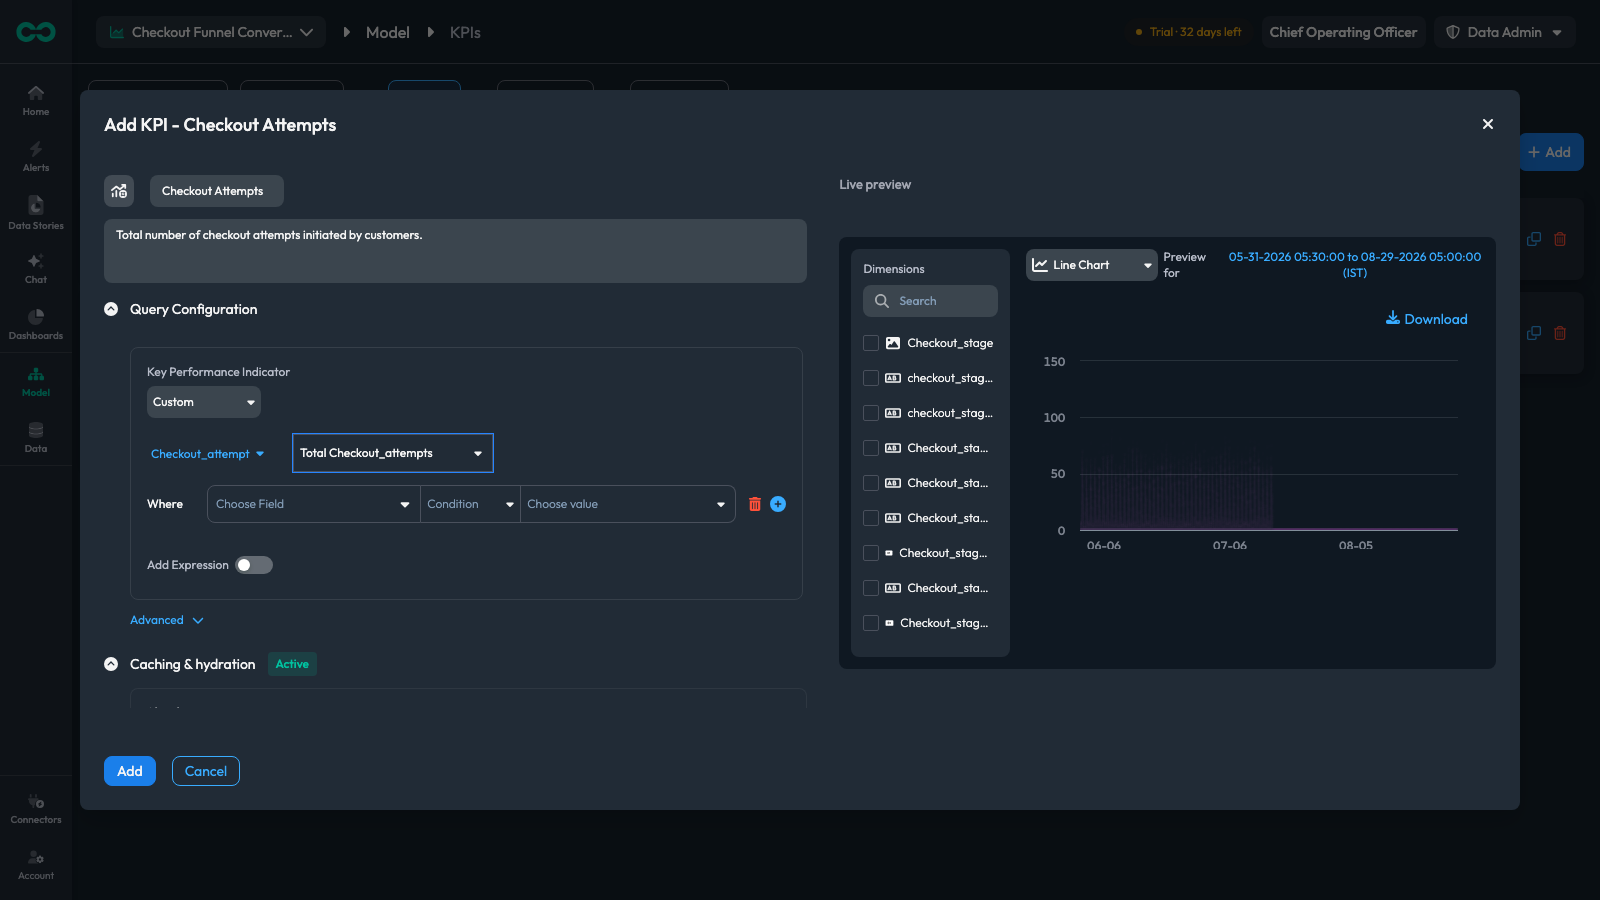
Take this route when you already know the event and field that carry the measurement, when you are reproducing a definition exactly, or when you are adjusting a KPI that Bicycle generated. If you know the question but not your schema, start from a prompt — you land in this same editor afterwards.
Add stays disabled until the definition is valid, and the reason sits beside it: Invalid metric configuration until a measure is chosen, Name is required if the name is cleared.
The editor reads from ingested event types. With none, it shows "No Event Types exist" — connect a source and ingest data first.
1. Name and description
KPI NameRequiredThe display name. It appears on the KPI list, in the KPI tree, on dashboards, and wherever an agent cites the metric — so name it for what it measures rather than how it is computed: Checkout Attempts, not count(Checkout_attempt).
IconThe tile to the left of the name. It is how the KPI is recognised at a glance in the card grid and the tree.
DescriptionWhat the KPI counts and, where it matters, what it excludes. Agents read this when deciding whether a KPI is relevant to a question, so the extra sentence is worth writing.
2. Query Configuration
What the KPI actually measures. View configuration opens the raw JSON behind the query at any point, with a copy button — the quickest way to confirm which field a metric resolved to.
Key Performance IndicatorRequiredDefault: CustomWhere the query starts. The dropdown lists every KPI already defined for this use case, plus Custom. Pick an existing KPI to start from its query and adjust it; pick Custom to define the measurement from scratch.
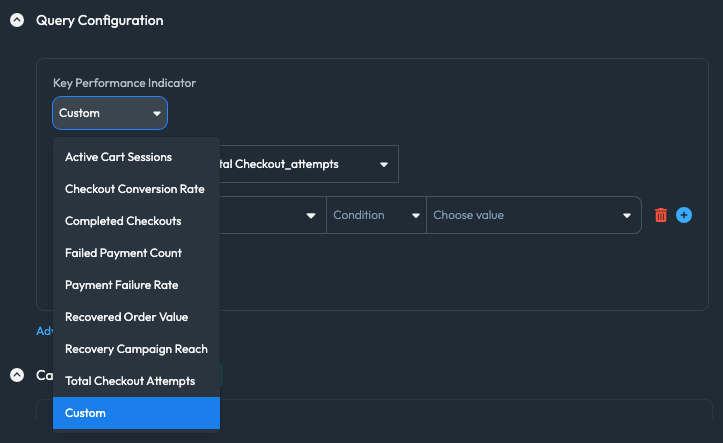
Selecting an existing KPI copies its query. The clone icon on the KPI's card in the list copies its whole configuration, caching included. For a variant of an existing KPI — the same measure with one more filter — clone from the list instead.
Event typeRequiredThe event stream the metric reads from. The picker is searchable — type part of the name to filter — and All Event Types measures across every event.
MeasureRequiredWhat is computed over those events.
**Total <EventType>s counts matching events — the right choice for volume metrics such as checkout attempts, failed payments, or sessions started.
Dimension is aggregates one field on the event. Two more controls appear: the field to aggregate and the aggregation function, which defaults to Count. Use this for value metrics — revenue, duration, order size.
Once a valid measure is selected, the Live preview starts rendering and Add becomes available.
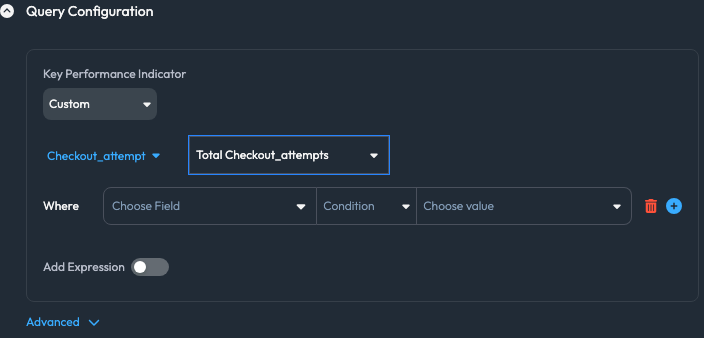
WhereFilters narrowing which events count towards the KPI. Each row is a field, a condition, and a value — for example is_dropped_at_stage · = · true, which is all that separates Abandoned Checkouts from a plain checkout-attempt count.
+ adds another condition, the trash icon removes one. Leave the row empty to count every event of that type.
3. Ratios and expressions
A rate or percentage is not one measure — it is one measure divided by another. Turn on Add Expression and the query becomes a set of named metrics you combine.
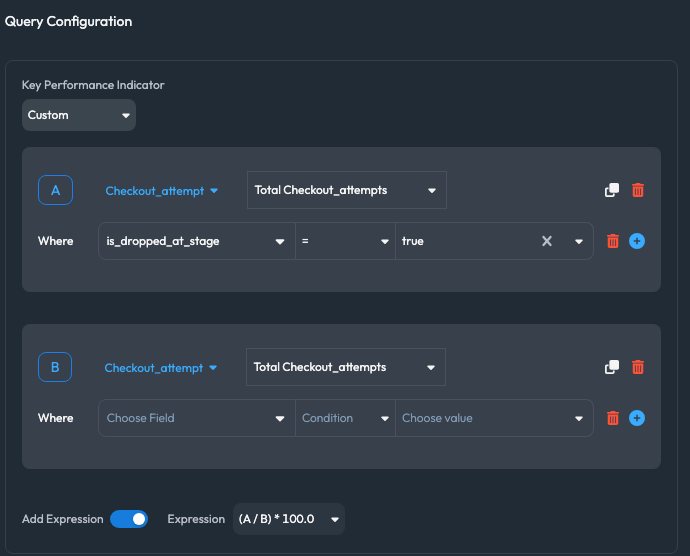
Each metric gets a letter — A, B, and so on — and each is configured exactly like the single measure above, with its own event type, measure, and Where rows. The Expression dropdown then combines them.
An abandonment or conversion rate is the common shape:
| Part | Definition |
|---|---|
| A | Total checkout attempts where is_dropped_at_stage · = · true — the numerator |
| B | Total checkout attempts, unfiltered — the denominator |
| Expression | (A / B) * 100.0 |
The two metrics usually share an event type and differ only in their filters, so duplicate the first with the copy icon beside it and remove the filter from the copy rather than building the second from scratch.
Add Expression gives you the ratio, not standalone KPIs for the numerator and denominator. To chart or alert on those separately, create them as their own KPIs — the prompt flow does this automatically.
4. Advanced
The properties that change how the KPI is aggregated and interpreted. The defaults suit most KPIs.
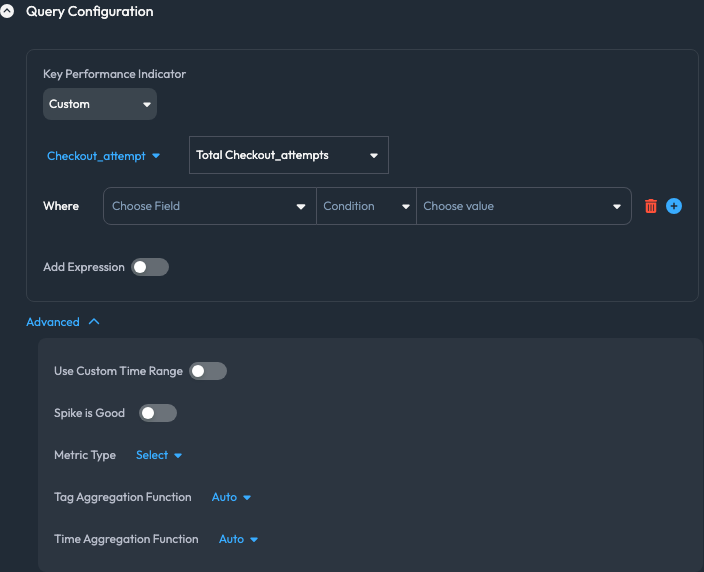
Use Custom Time RangeDefault: OffPins the KPI to a fixed window instead of following the time range selected on the page it appears in.
Spike is GoodDefault: OffWhich direction is healthy. Off means a spike is bad — correct for failure and abandonment metrics. Turn it on for metrics where up is good, such as conversion rate or revenue, so anomaly detection and alert copy read the right way round.
Metric TypeClassifies the metric — as a rate, a currency amount, and so on — so it is formatted and compared appropriately.
Tag Aggregation FunctionDefault: AutoHow values combine across dimensions when the KPI is rolled up, such as summing across regions. Auto infers it from the measure.
Time Aggregation FunctionDefault: AutoHow values combine across time when a chart shows a coarser grain than the KPI's own. Auto infers it from the measure.
This one toggle changes how every downstream pattern and alert talks about the KPI. A conversion rate left at the default reads as an incident when it improves.
5. Serving mode and the live preview
The Live preview pane does double duty: it shows the KPI's data, and it is where you choose how the KPI is served.
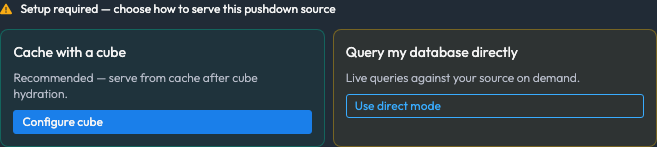
For a pushdown source with no serving mode chosen, the pane opens with Setup required — choose how to serve this pushdown source:
| Option | Behaviour | When to use |
|---|---|---|
| Cache with a cube (recommended) | Bicycle hydrates a cube and serves the KPI from cache — no query leaves your source once the cube is ready. | Almost always. It keeps load off your warehouse and makes the KPI fast everywhere it appears. |
| Query my database directly | Live queries run against your source on demand. | Data that must be read fresh every time, or while validating a definition against a source you do not want to cache yet. |
Once a cube serves the KPI, the pane shows a Cache-backed badge and "Cube ready. Serving from cache — no query left your source." A Verify against live source checkbox runs a one-off comparison of cached values against the live source — useful right after hydration, or when a number looks wrong.
Below that is the preview itself:
| Control | What it does |
|---|---|
| Dimensions | The fields available to break the KPI down by. Tick one to split the preview. |
| Chart type | Switches between Line Chart and the other renderings |
| Preview for | The window the preview covers |
| Download | Exports the previewed data |
A flat line at zero almost always means a Where filter matches nothing, or the aggregated field is not populated in this window. It is much cheaper to notice that here than after a pattern has been watching an empty KPI.
6. Caching and hydration
Configures the cubes behind the KPI. An Active chip next to the heading means at least one cube is serving it. Defaults are applied for you — open this section when you need to control grain, freshness, or history.
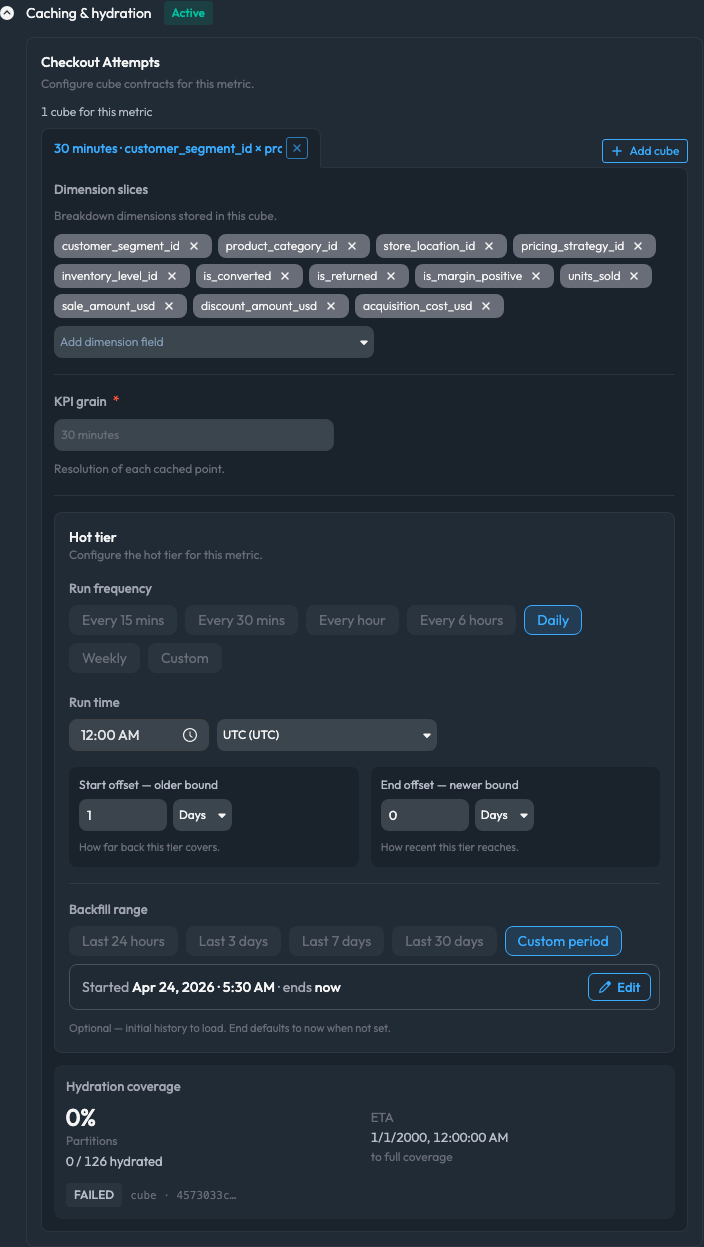
CubesThe cube contracts for this metric, each a chip summarising its grain and dimensions. + Add cube creates another — worth it when different consumers need different grains or dimension sets.
Dimension slicesThe breakdown dimensions stored in the cube. Only dimensions listed here can slice the KPI without falling back to the source, so include the ones you expect to investigate by. Each extra dimension increases the cube's size.
KPI grainRequiredDefault: 30 minutesThe resolution of each cached point. Finer grain means more responsive alerting and a larger cube. Widening it later is easy; narrowing it means rehydrating — so err towards the finest grain you will genuinely use.
Run frequencyDefault: DailyHow often the hot tier refreshes: Every 15 mins, Every 30 mins, Every hour, Every 6 hours, Daily, Weekly, or Custom. Match it to how quickly you need to see a change, not to the KPI's grain.
Run timeThe time of day, and the timezone it is read in, for schedules that run daily or less often.
Start offset — older boundDefault: 1 DaysHow far back this tier covers.
End offset — newer boundDefault: 0 DaysHow recent this tier reaches. Leave at 0 to include data up to now.
Backfill rangeOptional initial history to load — Last 24 hours, Last 3 days, Last 7 days, Last 30 days, or a Custom period. The end defaults to now when it is not set. Backfill is what makes historical comparison and anomaly baselines possible on a brand-new KPI.
Hydration coverage reports progress as a percentage, a hydrated-partition count, and an ETA to full coverage. A cube reporting FAILED needs attention before the KPI can be trusted — the preview may still render from a partial cache.
Save
Click Add. Bicycle validates the caching configuration at this point too, so an incomplete cube is reported here rather than after saving.
The modal closes and the KPI appears in the Model → KPI grid with its icon, name, and description, alongside edit, clone, and delete icons.
Things to know
- This is the same editor generated KPIs land in. Anything Bicycle creates from a prompt can be opened and edited here, field for field.
- KPI grain is effectively permanent. Widening it later is easy; narrowing it means rehydrating the cube.
- A KPI is scoped to its use case. To measure the same thing for another use case, create it there too — cloning works within a use case, not across them.
- Deleting a KPI affects what depends on it. Patterns, drivers, and dashboard widgets referencing it lose their source. Check the KPI tree before deleting a metric that others roll up from.
Troubleshooting
| Symptom | Likely cause | Fix |
|---|---|---|
| No Event Types exist | The use case has no ingested event types | Connect a source and ingest data before defining KPIs |
| Add disabled with Invalid metric configuration | No measure selected, or an expression metric is incomplete | Choose **Total <EventType>s or Dimension is for every metric in the query |
| Add disabled with Name is required | The name field is empty | Give the KPI a name |
| Preview shows a flat zero line | A Where filter matches nothing, or the aggregated field is empty in this window | Check the filter values, and confirm the field in View configuration |
| Preview never leaves Loading… | A large query against a direct-mode source | Give it a moment, or switch the KPI to Cache with a cube |
| Setup required — choose how to serve this pushdown source | The KPI reads from a pushdown source with no serving mode chosen | Pick Cache with a cube, or Use direct mode |
| Hydration coverage stuck at 0%, or a FAILED cube | The cube failed to hydrate | Check the cube's dimension slices and grain, then retry; the preview may still render from partial cache |
| Anomalies read backwards — an improvement raises an alert | Spike is Good left at its default for a metric where up is good | Turn it on under Advanced |
Next: Pattern Engine — watching this KPI for anomalies.