Create a KPI with a prompt
From Model → KPI, click + Add. The Add KPI modal leads with a prompt box: describe what you want to measure, and Bicycle reads your event schema, works out which events and fields carry that measurement, builds the query, and hands you a set of draft KPIs to review.
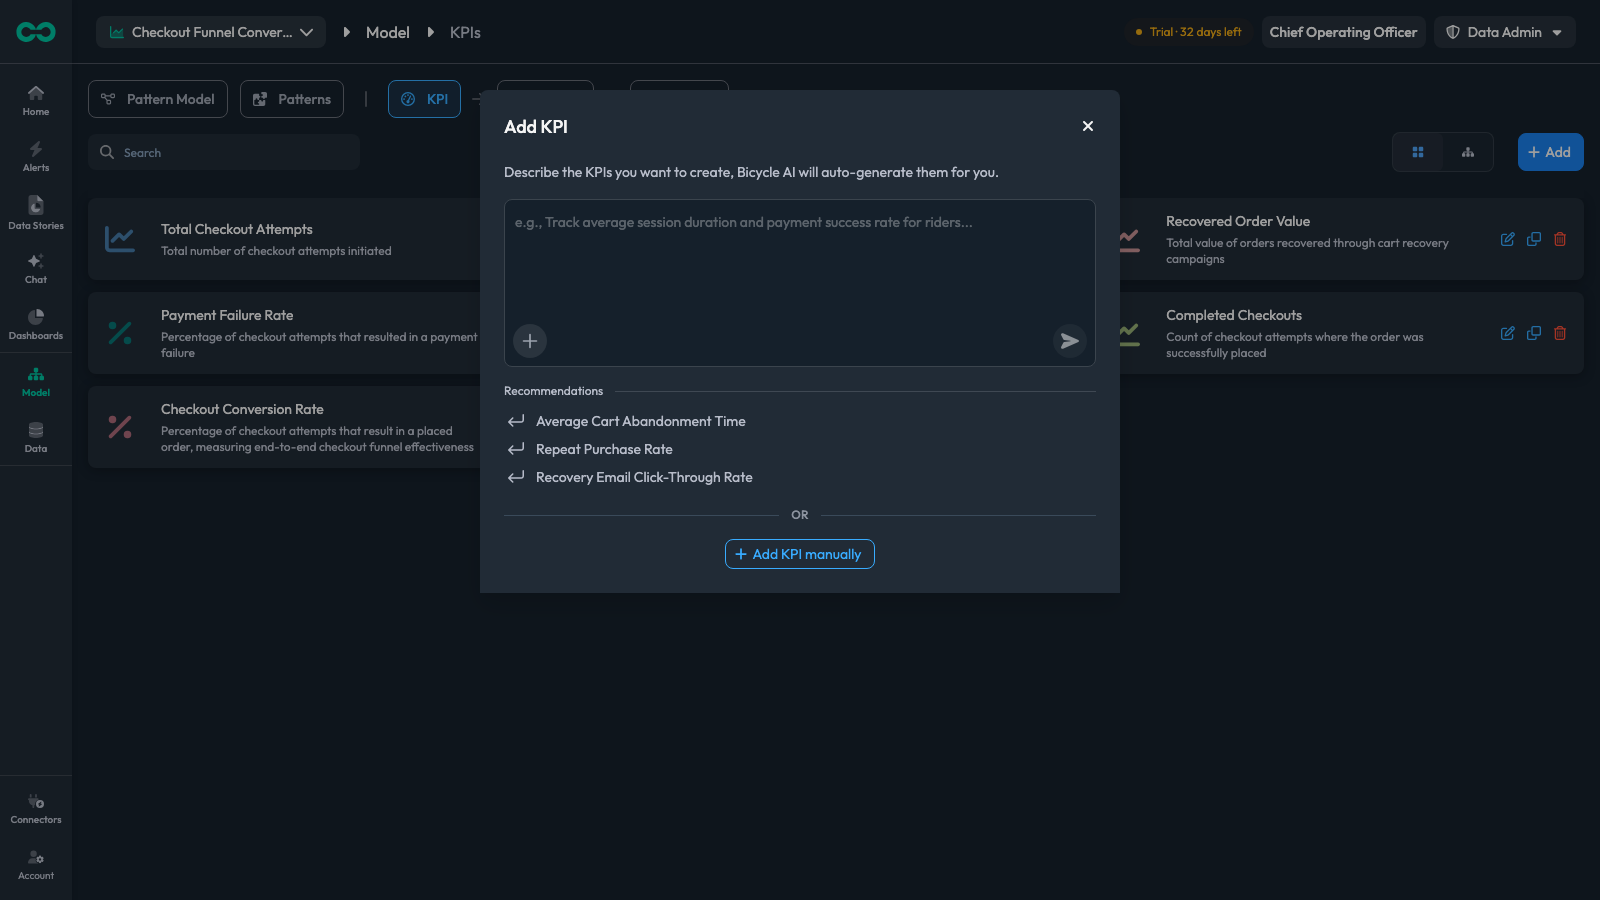
This is the faster route when you know the business question but not the shape of your data. It is also the only route that builds a set of related KPIs in one pass — ask for a rate and Bicycle creates the numerator, the denominator, and the ratio over them.
A run produces drafts. Every generated KPI is fully editable in the same panel, each has a checkbox, and nothing is written to the use case until you click Save.
1. Write the prompt
Type your prompt, or click one of the Recommendations to fill the box with its text. The + button attaches a file, and the microphone dictates.
A good prompt names the measurement and the population it applies to. Bicycle resolves the rest against your schema, so you do not need to know field names.
| Instead of | Write |
|---|---|
abandonment | Track cart abandonment rate and average time to abandon for checkout sessions |
payments | Percentage of payment attempts that fail, split out from total payment attempts |
delivery | Median delivery time and the share of orders delivered later than promised |
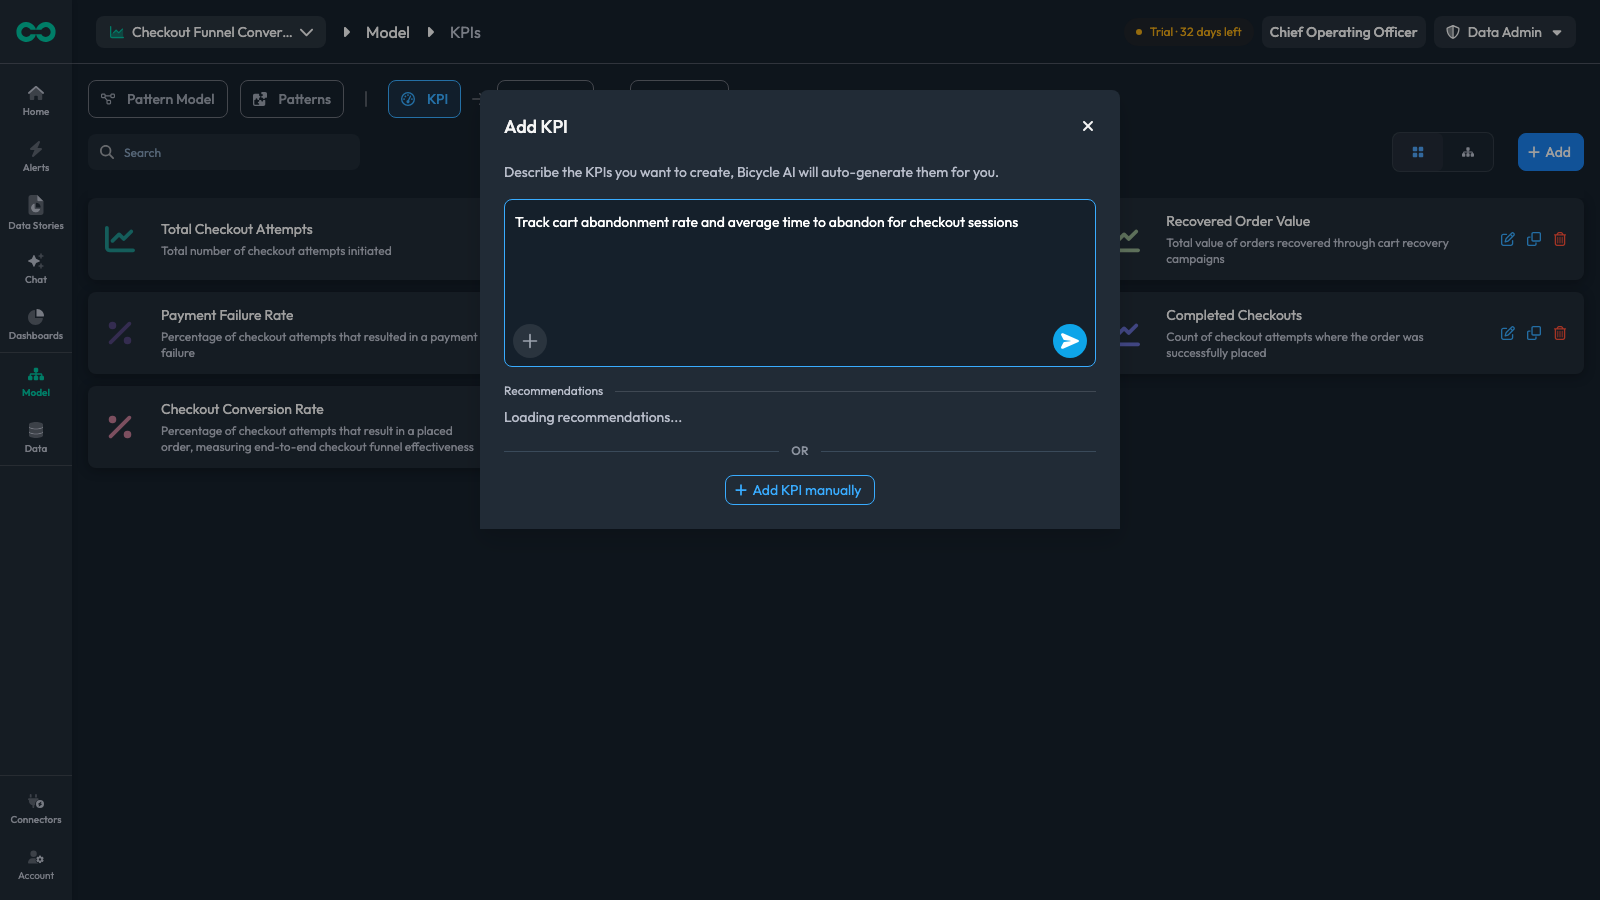
Ask for a rate or percentage explicitly when that is what you want — Bicycle then creates the supporting counts alongside it rather than leaving you to assemble the ratio.
The three items under Recommendations are suggestions generated for this use case — Average Cart Abandonment Time, Repeat Purchase Rate. Clicking one fills the prompt box with its full text rather than creating anything, so you can edit it first.
The send button stays disabled until the box has text. Send the prompt to start the run.
2. Watch the run
Sending takes you to Model → KPIs → Create KPI, a split view with the generated artifact on the left and the Chat panel on the right.
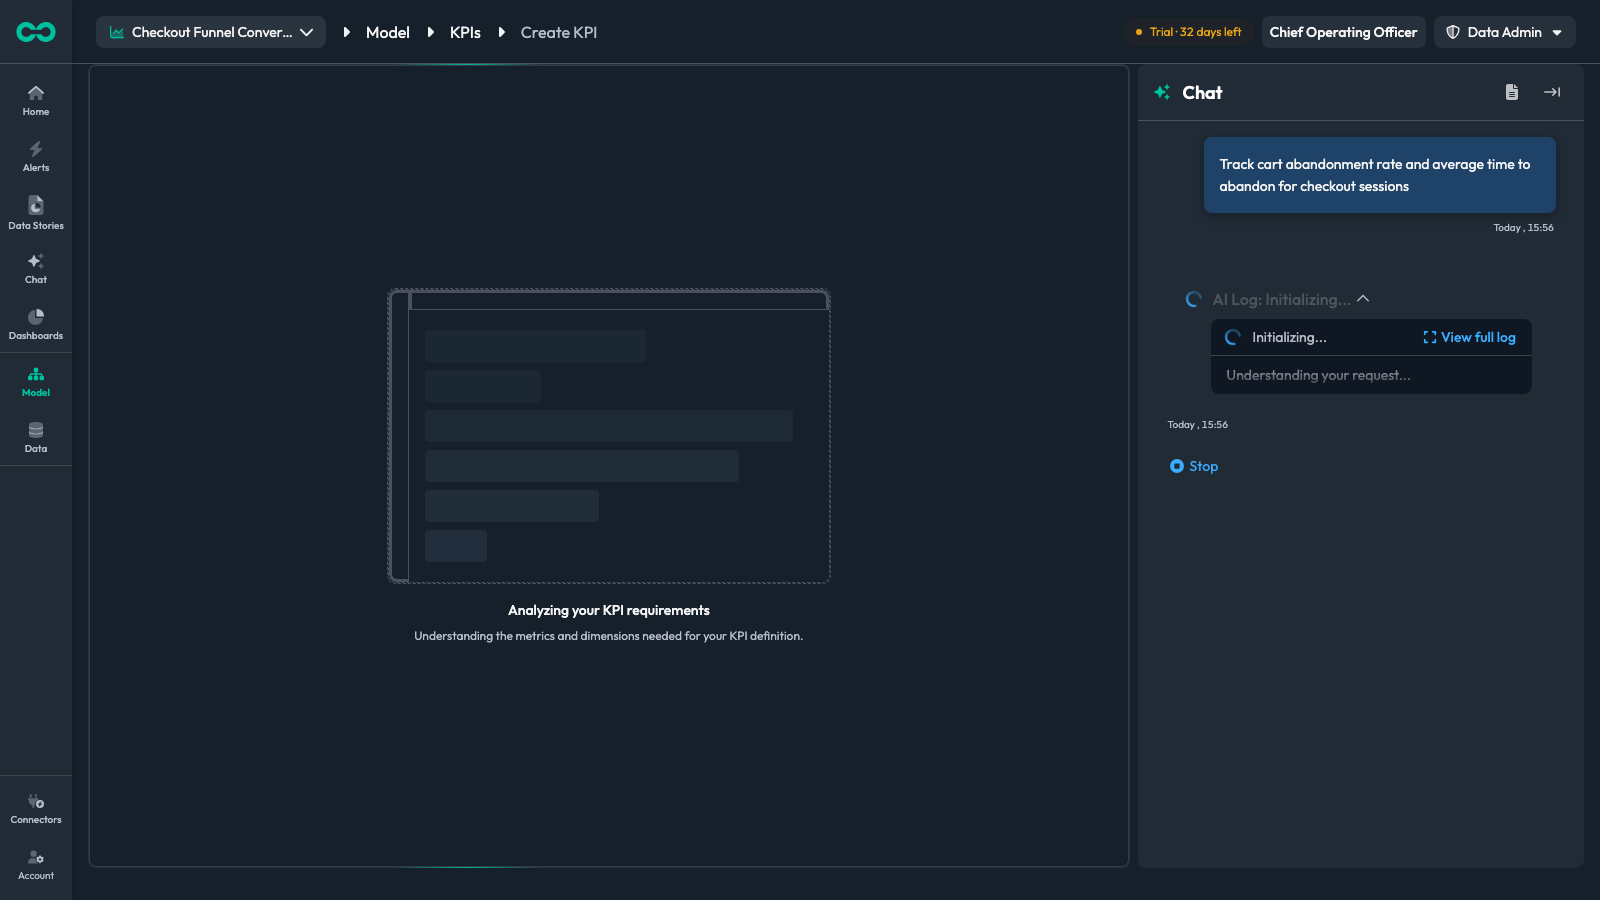
The left panel cycles through three phases:
| Phase | What Bicycle is doing |
|---|---|
| Analyzing your KPI requirements | Understanding the metrics and dimensions needed for your KPI definition |
| Building KPI configuration | Mapping data sources and setting up the KPI structure |
| Generating KPI artifacts | Creating visualizations and validation rules for your KPI |
The chat panel shows your prompt, then a running AI Log. Each entry names the step in progress — querying the ontology for event types, reading prefetched event summaries — and expands to show its detail; View full log opens the complete output for a step. Stop ends the run.
A run usually takes a couple of minutes. Leave the tab open; the panel updates on its own.
3. Review the drafts
When the run finishes, the left panel becomes a KPIs list. Each generated KPI is a card with a checkbox, and selecting a card shows its full definition beside it.
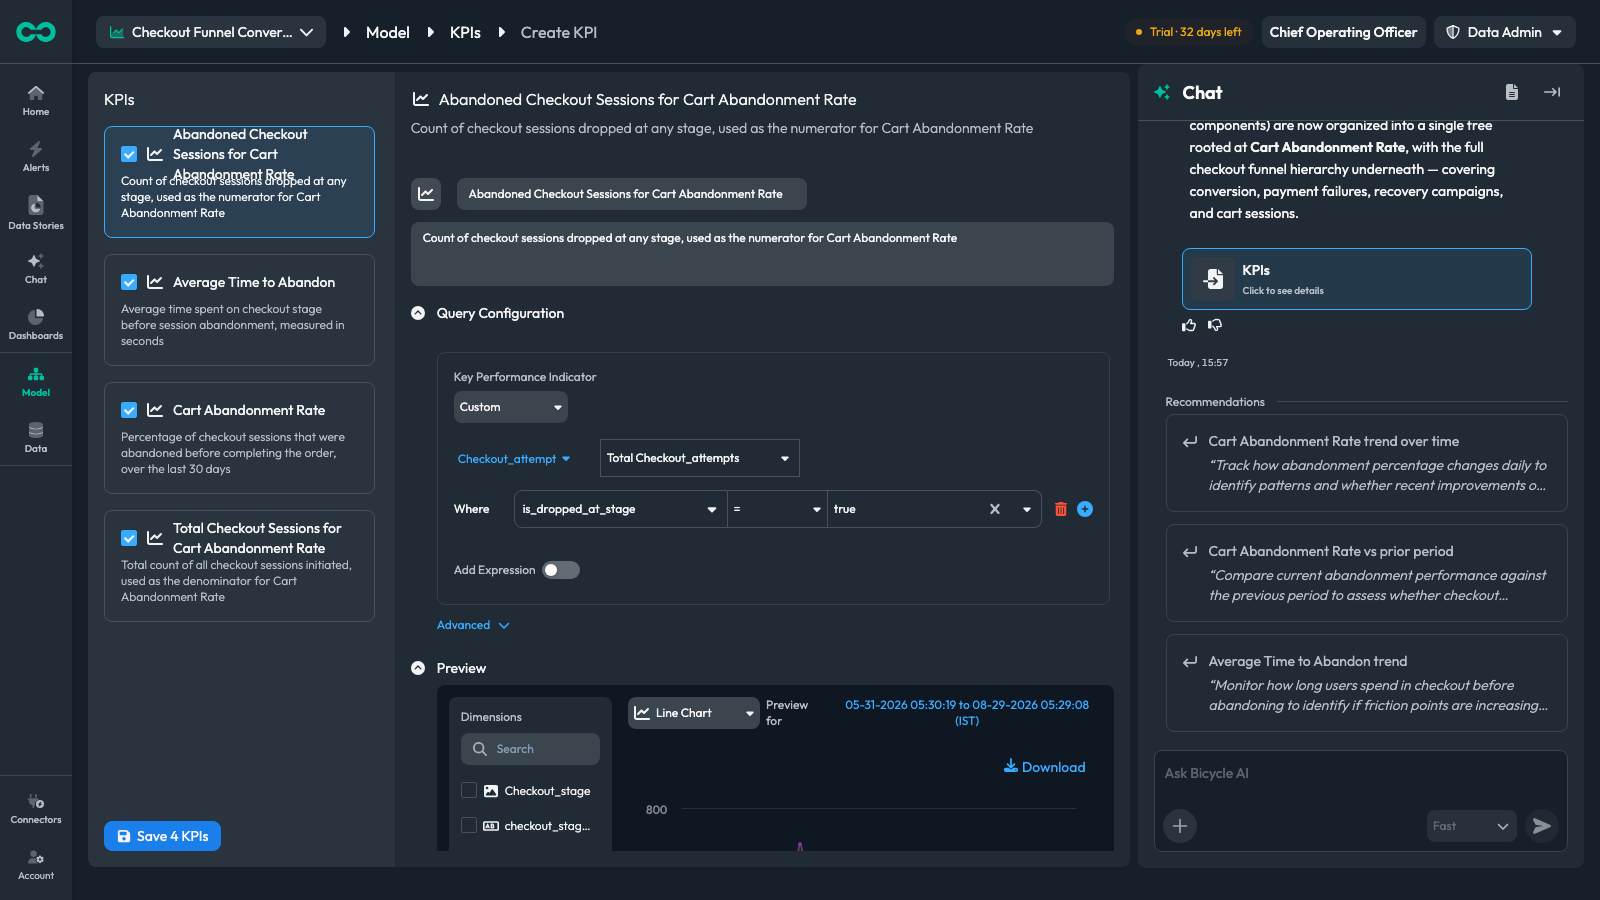
For the prompt "Track cart abandonment rate and average time to abandon for checkout sessions", Bicycle produced four KPIs — the rate that was asked for, the two counts it is built from, and the timing metric:
| Generated KPI | Role |
|---|---|
| Abandoned Checkout Sessions for Cart Abandonment Rate | Count of checkout sessions dropped at any stage — the numerator |
| Total Checkout Sessions for Cart Abandonment Rate | Total count of all checkout sessions initiated — the denominator |
| Cart Abandonment Rate | The percentage, built as an expression over the two counts above |
| Average Time to Abandon | Average time spent on a checkout stage before the session was abandoned, in seconds |
The decomposition is deliberate. The supporting counts are real KPIs in their own right, so they can be charted, alerted on, and investigated separately — not only the ratio built on top of them.
Check the definition, not just the name
The detail pane is the same editor used when you build a KPI by hand, and it is live. Read the query before saving, and change anything that is wrong.
Three things are worth confirming on every generated KPI:
The event type and measure
Under Query Configuration, check which event Bicycle chose and what it measures — a count of events, or an aggregation over a specific field.
The filters
The Where rows narrow the population. For the abandonment numerator that is is_dropped_at_stage · = · true. View configuration shows the raw JSON, which is the quickest way to confirm exactly which field a metric resolved to.
The preview
The Preview section renders the KPI against your real data. A flat line at zero usually means the filter matches nothing or the field is not populated — much cheaper to notice here than after a pattern has watched an empty KPI for a week.
For a ratio, Add Expression is switched on and the query is built from named metrics — A for abandoned checkout sessions, B for all checkout sessions — combined by the Expression dropdown as (A / B) * 100.0.
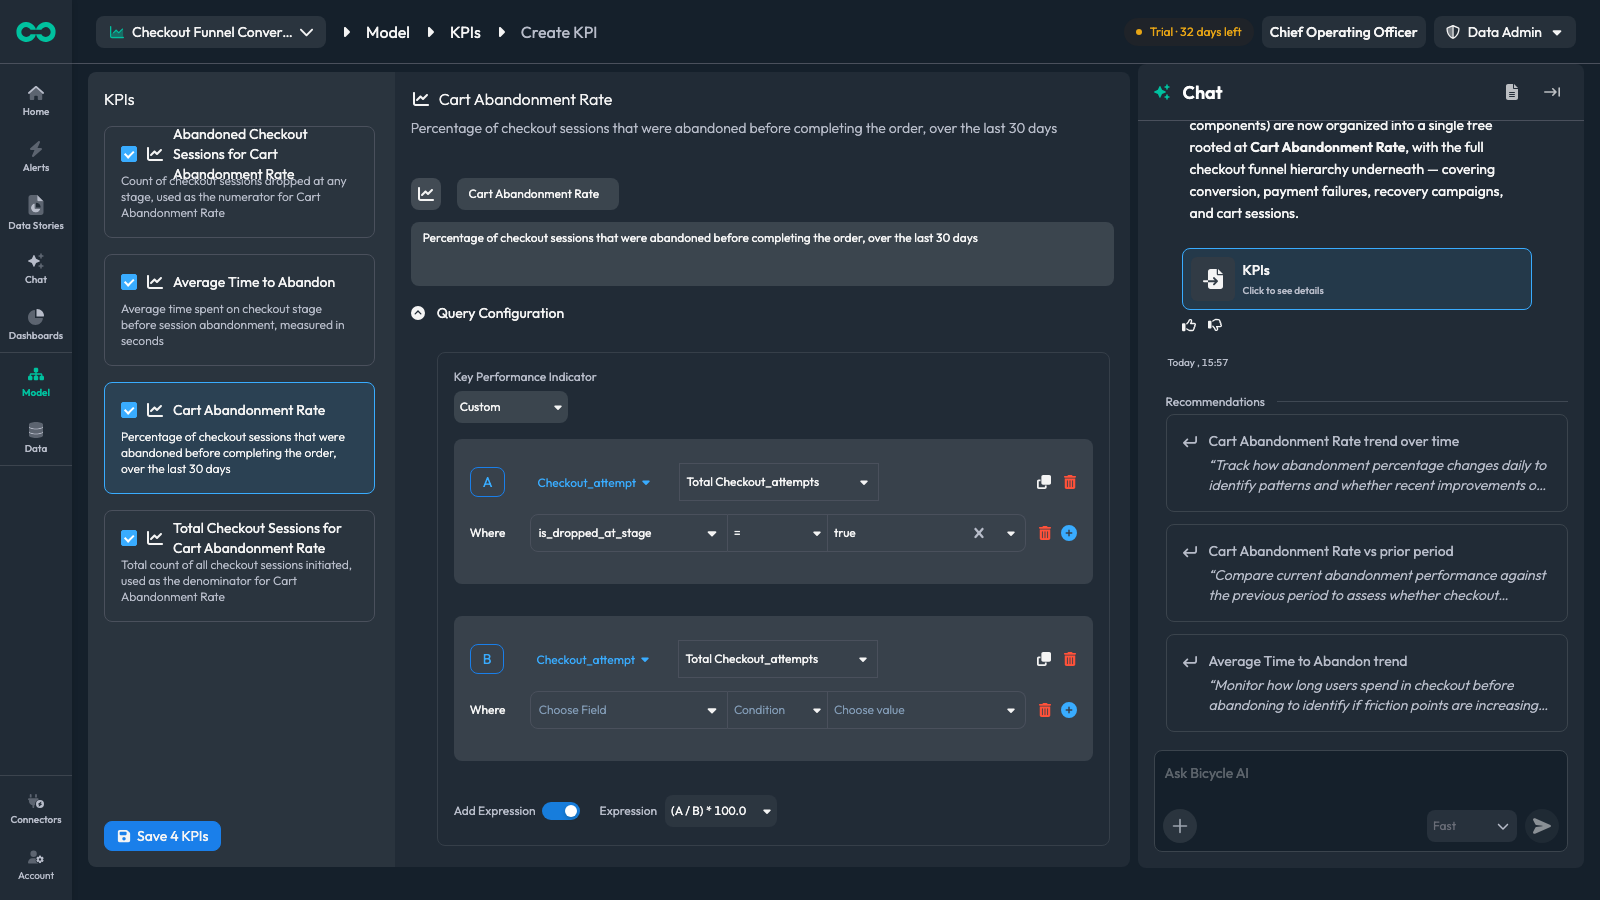
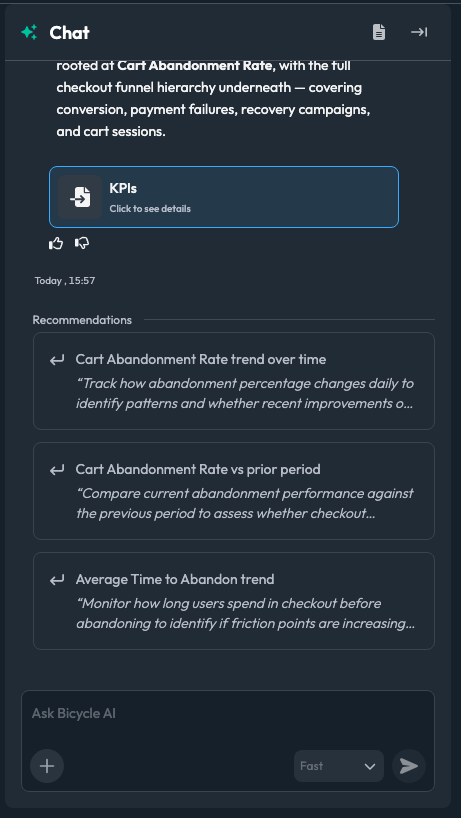
The chat panel stays open. If a KPI is close but wrong — the wrong event, a missing filter, a metric you also want — say so in Ask Bicycle AI and the agent revises the drafts in place. The Recommendations below the answer suggest follow-up analyses to run once the KPIs are saved.
4. Save
Every card starts selected. Clear the checkbox on anything you do not want — the button counts what is left, so it reads Save 3 KPIs once one of four is deselected.
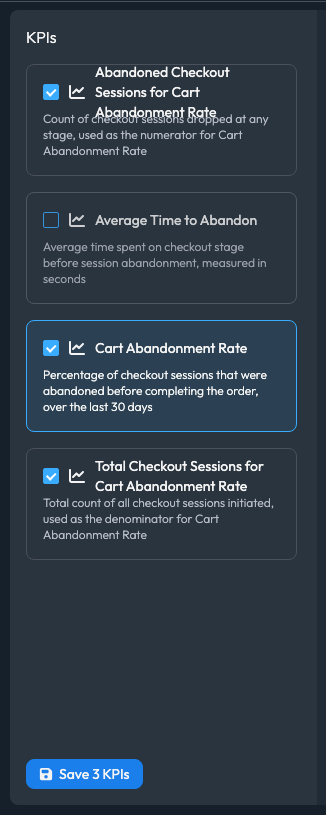
It is tempting to deselect the numerator and denominator and keep only the ratio. The ratio's expression is defined over those metrics, and they are useful on their own — when a rate moves, the two counts are what tell you whether the numerator rose or the denominator fell.
Click Save N KPIs. The button shows Saving... while the KPIs are written to the use case, and they then appear in the Model → KPI grid alongside the existing ones.
Things to know
- Drafts do not survive the session. A run lives in its chat session. Close the tab before saving and the KPIs are gone — rerun the prompt rather than hunting for the session.
- Bicycle can only use fields you have ingested. If a prompt asks for something your schema does not carry, the agent says so in the chat and substitutes the closest proxy — for example, a stage-level median time in place of a true session duration. It names the substitution; read that part of the answer before saving.
- Generated names are long on purpose. Supporting metrics are named for the KPI they feed, so their role stays obvious in a long list. Rename them in the detail pane before saving if you prefer something shorter.
- Caching uses defaults. Generated KPIs are saved with a default serving configuration. To control cube grain, hydration schedule, or backfill, edit the KPI afterwards — see Caching and hydration.
- Prompting does not replace review. The query is a proposal from a model reading your schema. The Preview is the check that it means what you think it means.
Next: Create a KPI manually — the same editor, field by field.