KPIs overview
A KPI is a named, reusable measurement over your event data — Checkout Conversion Rate, Failed Payment Count, Average Time to Abandon.
Everything else in Bicycle points at KPIs. Patterns watch them for anomalies, drivers explain what moved them, dashboards chart them, and agents cite them as evidence during an investigation. Defining the right KPIs is the first modelling step, and the one the rest of the model rests on.
KPIs live under Model → KPI, scoped to one use case.
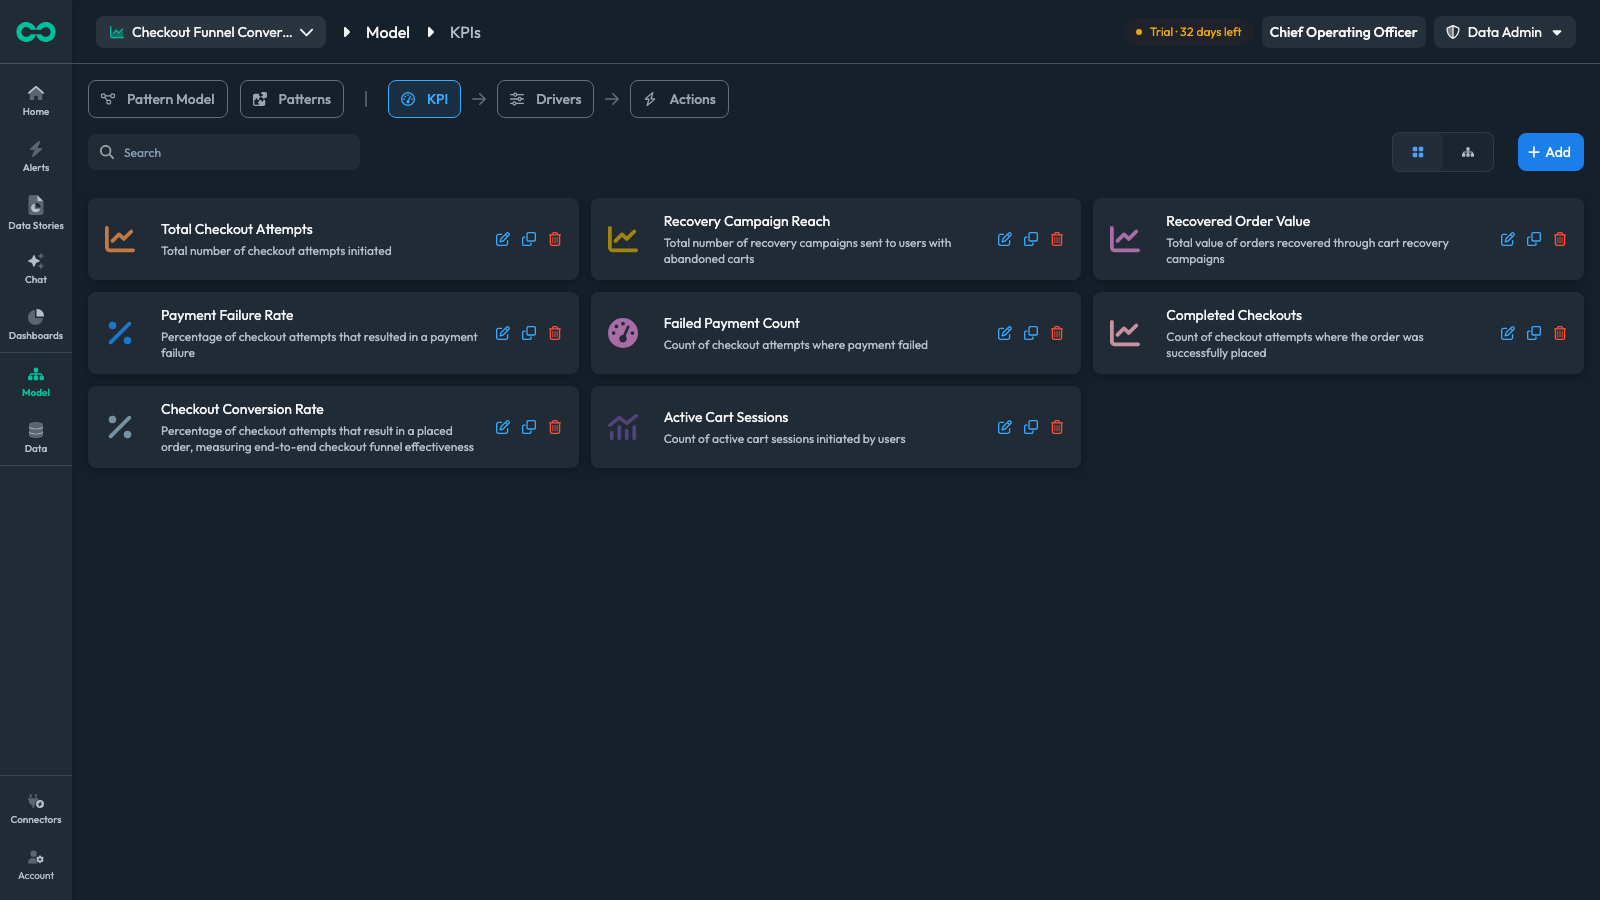
The list is scoped to the use case in the top-left picker. With All analytics agents selected the page shows "Select a use case to continue" — pick one to load its KPIs.
Two ways to create one
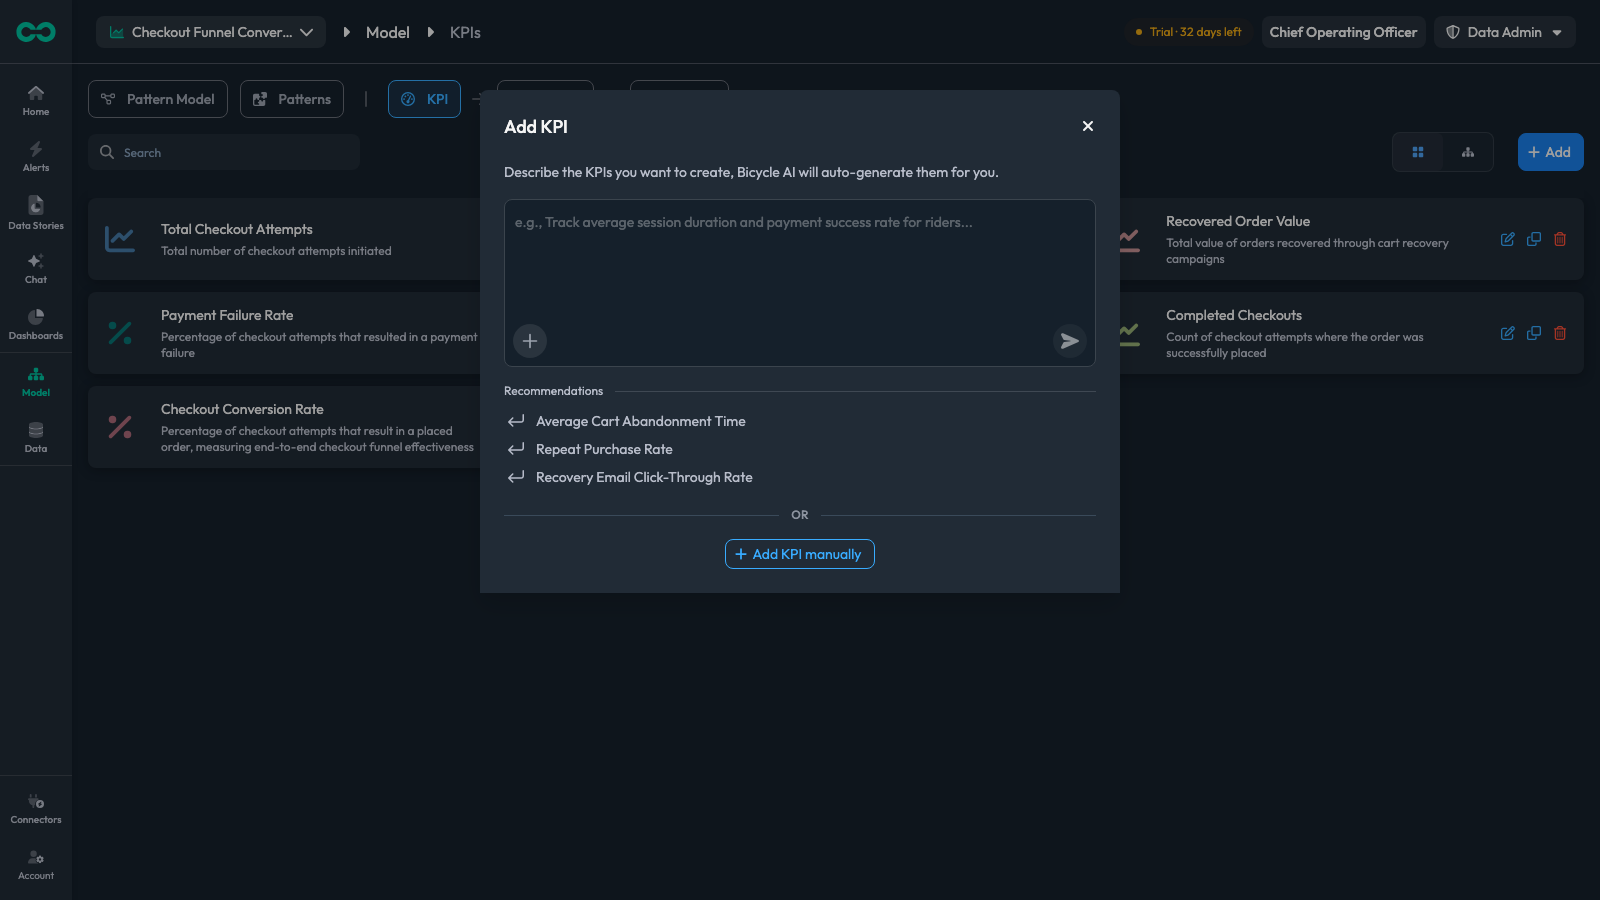
+ Add opens a single modal that offers both routes. They produce the same kind of object and share the same editor, so the choice is about where you start, not what you end up with.
| Method | How it works | Best when |
|---|---|---|
| With a prompt | Describe the measurement in a sentence. Bicycle reads your event schema, picks the fields, builds the query, and proposes a set of draft KPIs to review and save. | You know the business question but not which events and fields carry it — and when one metric needs several supporting KPIs, as a ratio needs its numerator and denominator. |
| Manually | Define the KPI yourself: event type, measure, filters, and — for a ratio — the expression. A live preview renders as you build. | You know the exact event and field, you are reproducing a definition precisely, or you are adjusting one that already exists. |
The prompt flow hands you a fully editable draft in the same editor the manual route uses. Describing the metric in a sentence, letting Bicycle find the fields, then correcting a filter before saving gets you the schema discovery without giving up control of the definition.
Core concepts
Event typeThe stream a KPI reads from — Checkout_attempt, Payment_event. One metric reads from one event type, or from All Event Types.
MeasureWhat is counted or aggregated: a count of events, or an aggregation over a field on the event such as the sum of a revenue column.
FilterA Where condition narrowing which events count. Abandoned Checkouts is a checkout-attempt count with one filter on top.
ExpressionA formula combining named metrics — A, B, and so on — into one value. Rates and percentages are expressions: (A / B) * 100.0.
DimensionA field a KPI can be broken down by, such as region or customer_segment_id. Dimensions are what let a pattern catch a drop confined to one segment.
CubeThe cache a KPI is served from. A hydrated cube answers queries without touching your source. See Caching and hydration.
KPI treeThe relationships between an agent's KPIs — which inputs roll up into which outcome metric.
Reading the KPI list
| Control | What it does |
|---|---|
| Search | Filters the list by KPI name |
| Grid / tree toggle | Switches between the card grid and the KPI tree canvas |
| + Add | Opens the Add KPI modal — the entry point for both creation methods |
| Card icons | Edit the KPI, clone it as the starting point for a new one, or delete it |
Cloning is worth knowing about before you create anything: if the KPI you want is a variant of one that exists — the same measure with one more filter — the clone icon gives you its whole configuration, caching included, rather than just its query.
The KPI tree
The tree view shows how an agent's KPIs relate: which inputs feed which outcome. Checkout Conversion Rate sits above Completed Checkouts and Total Checkout Attempts because it is computed from them.
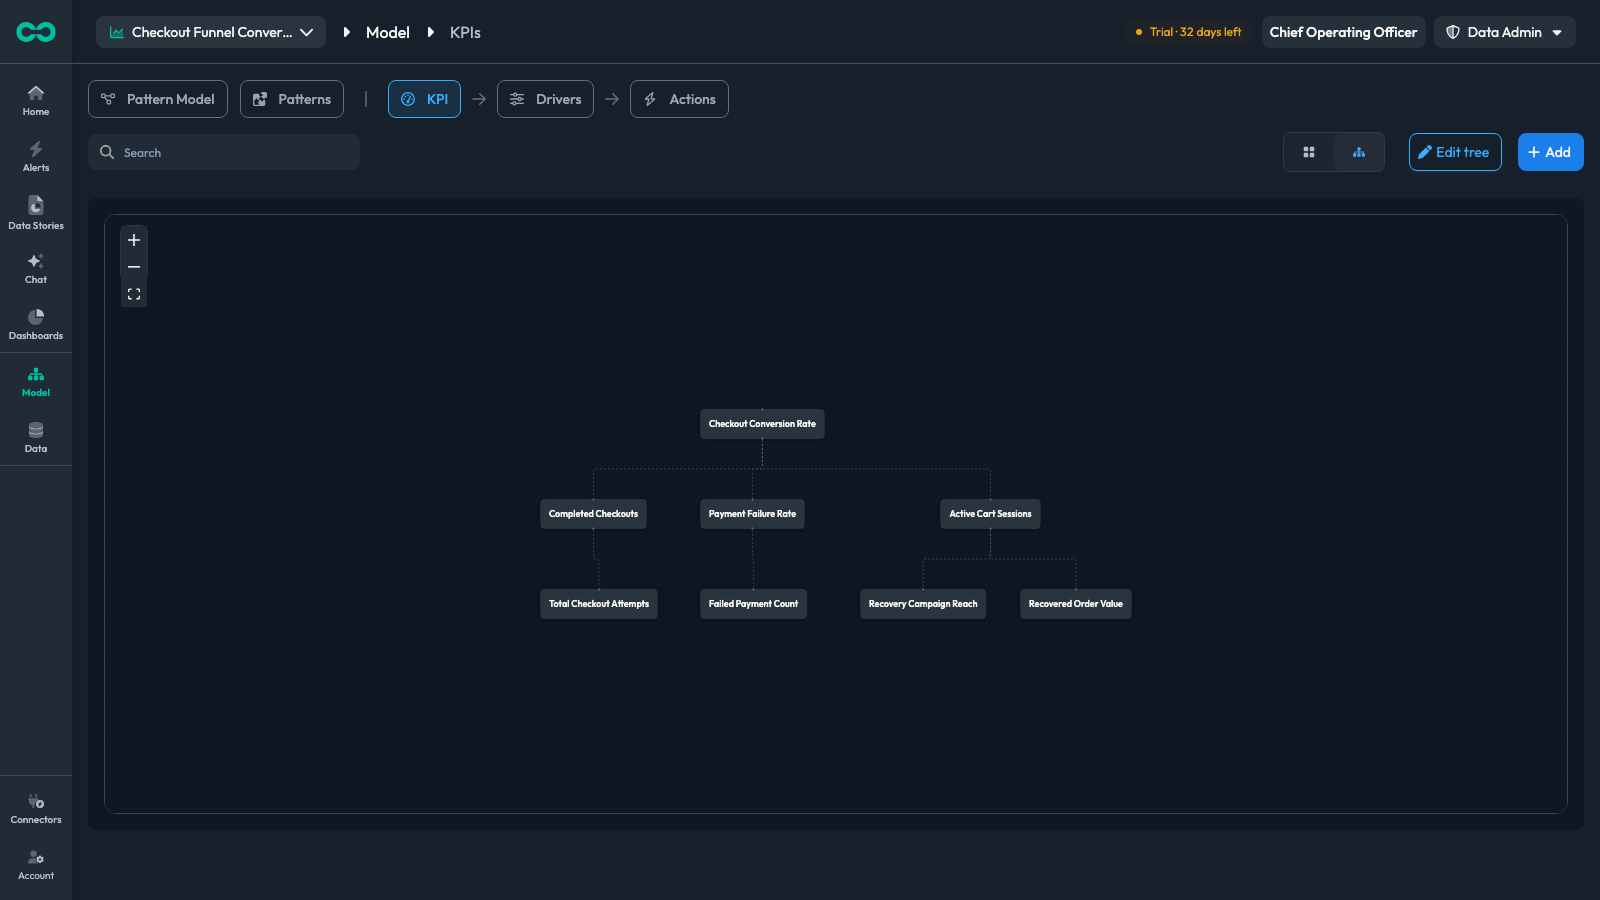
Edit tree rearranges the relationships. The tree is worth keeping accurate — it is what tells an investigation which metrics to look at next when an outcome KPI moves.
Where to go next
- Create a KPI with a prompt — describe it, review the drafts, save
- Create a KPI manually — the editor, field by field
- Pattern Engine — watching a KPI for anomalies once it exists