Create a pattern
From Model → Patterns, click Add. The Detect tab is where a pattern is defined; everything else has a sensible default you can revisit later.
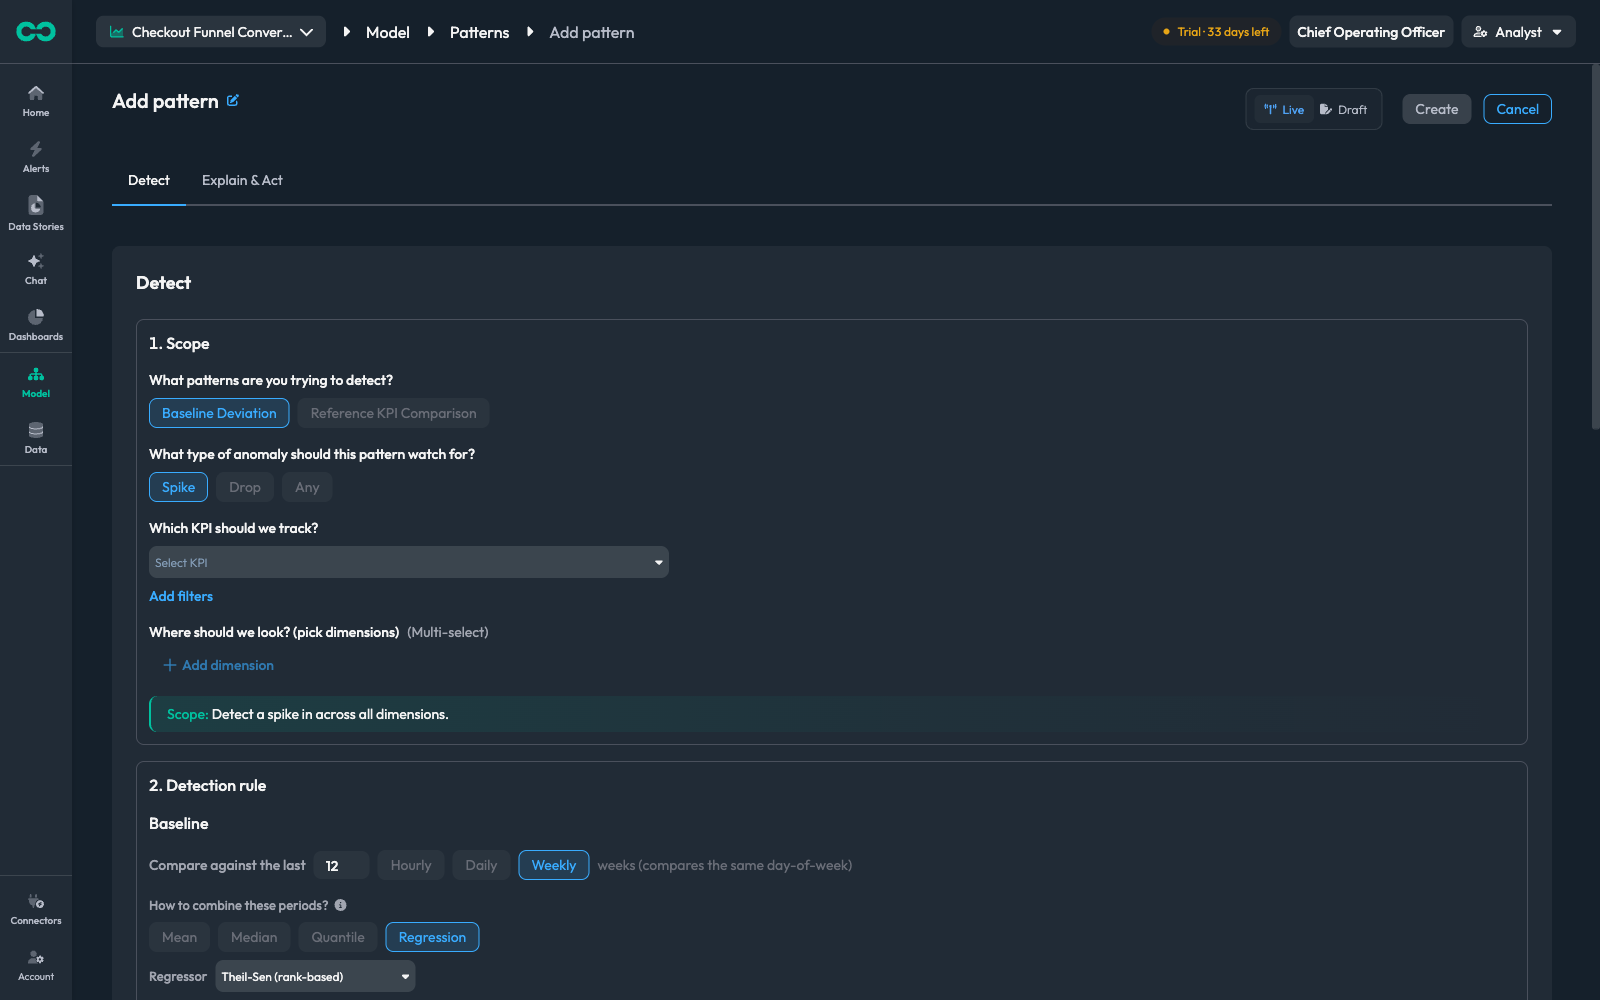
The header carries the pattern's name (click the pencil to change it), the Live / Draft toggle, and Create. New patterns are usually worth creating as Draft first — they run and detect immediately, but nothing reaches the alert feed until you promote them.
The Detect tab has four cards, in order.
1. Scope
What to watch, and where.
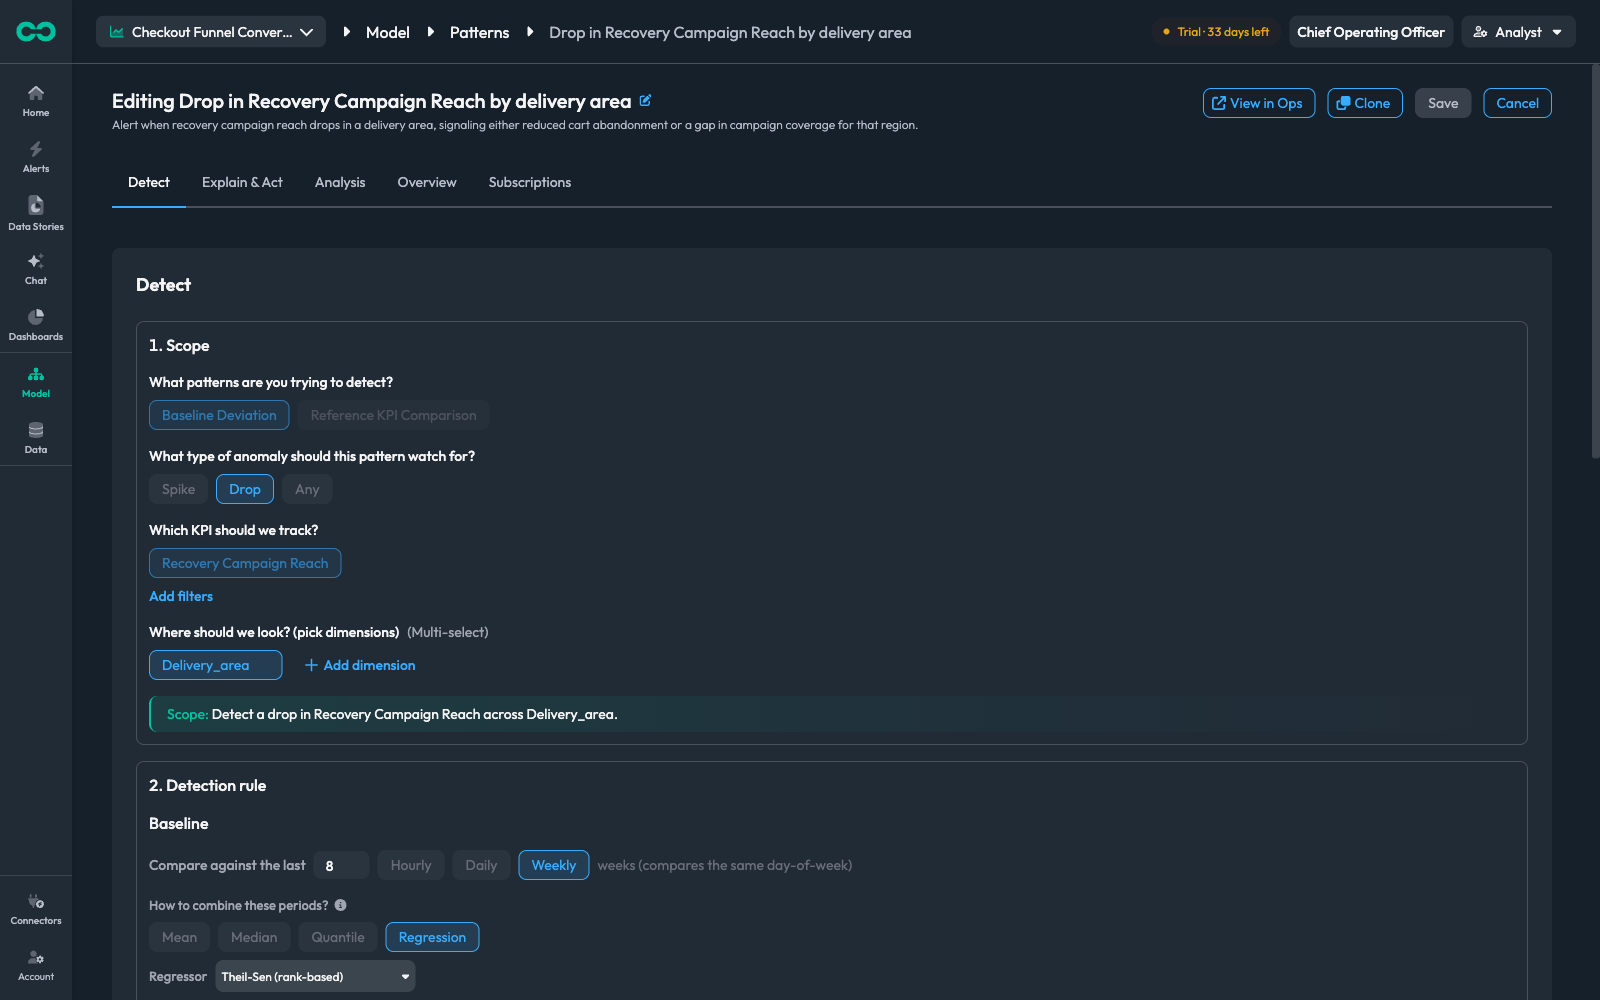
What patterns are you trying to detect?RequiredDefault: Baseline DeviationBaseline Deviation compares the KPI against its own history. Reference KPI Comparison compares it against a second KPI instead — use this when the meaningful signal is a gap between two metrics rather than a change in one.
What type of anomaly should this pattern watch for?RequiredDefault: SpikeSpike, Drop, or Any. Direction matters: a pattern watching for drops ignores a sudden rise entirely. Most patterns should pick a side — one pattern per direction reads more clearly in the feed than one that fires on both.
Which KPI should we track?RequiredThe metric being watched. Add filters narrows it to a subset of rows before any comparison happens — for example, only paid orders.
Where should we look? (pick dimensions)The dimensions to slice by. Each segment is evaluated on its own, so a drop confined to one delivery area is caught even when the total looks flat. Multi-select. Leave it empty to evaluate the KPI as a single overall series.
The green Scope line at the bottom of the card restates your choices as a sentence. It is the fastest way to confirm the pattern says what you meant.
2. Detection rule
How the expected value is computed, and how far off is far enough.
Baseline
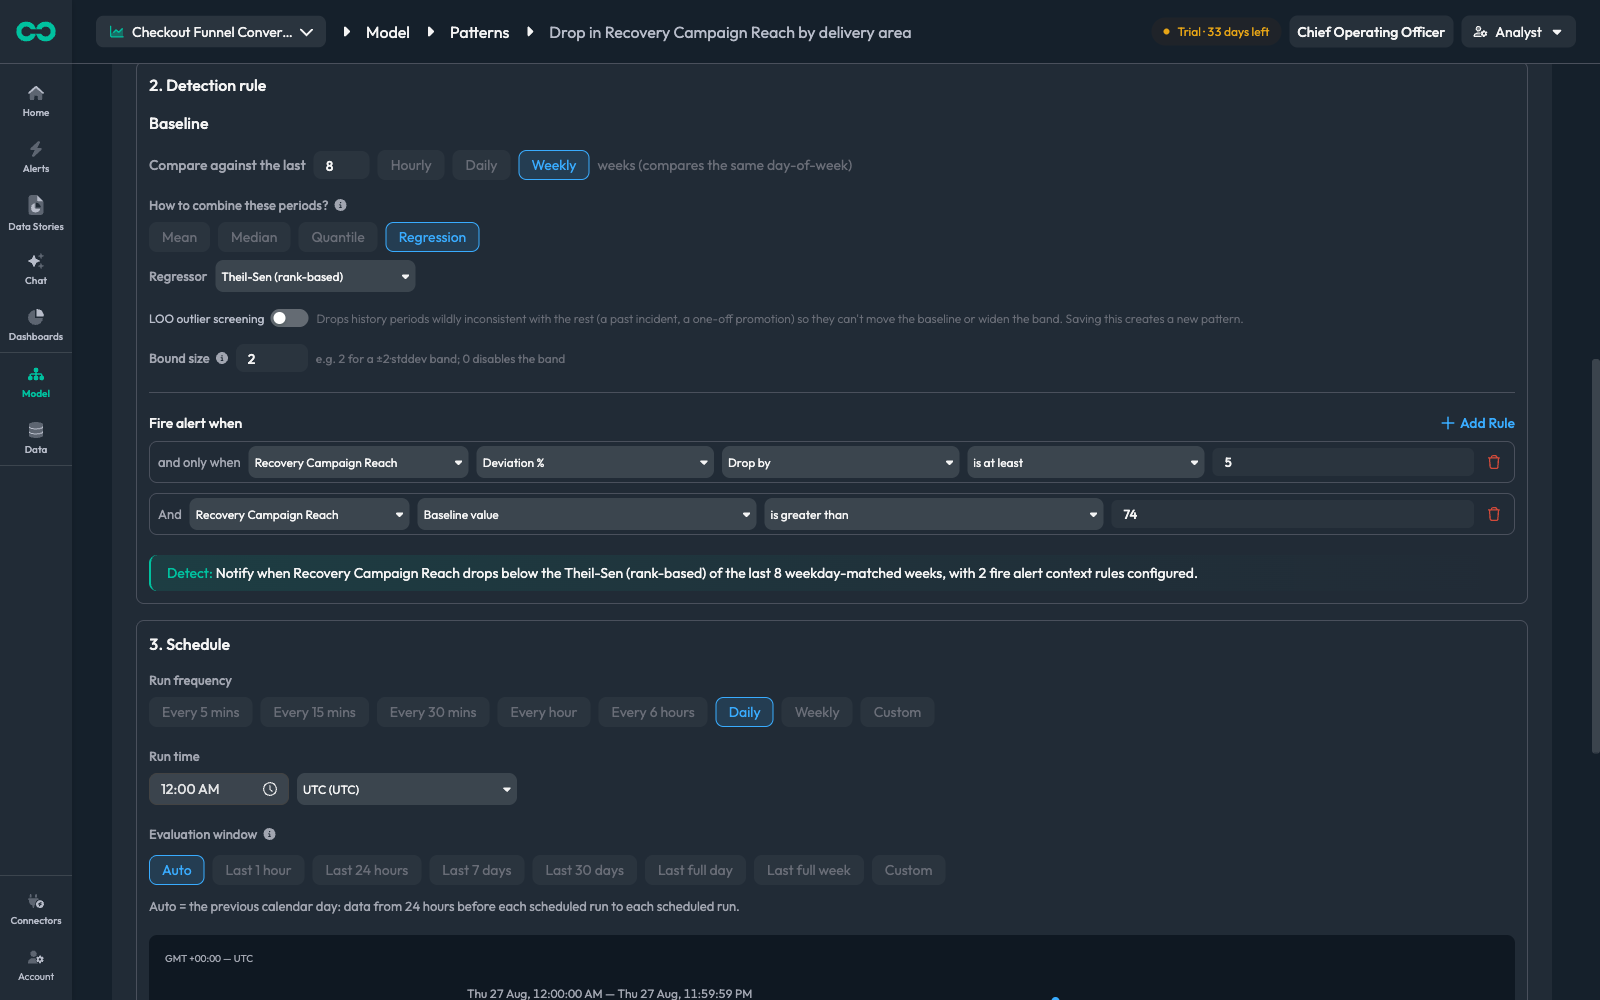
Compare against the last N periodsRequiredDefault: 12 weeklyHow much history the baseline is built from, and how those periods are matched. Weekly compares the same day-of-week (so Monday is judged against Mondays), Daily the same day, Hourly the same hour. Pick the seasonality your KPI actually has — a metric with a strong weekly rhythm judged against a flat daily baseline will alert every Monday.
How to combine these periods?RequiredDefault: RegressionMean and Median average the history — median is the more robust of the two. Quantile compares against a percentile. Regression fits a trend line, so a KPI that is steadily growing is not flagged simply for growing.
RegressorDefault: Theil-Sen (rank-based)Only shown for Regression. OLS (linear) is the plain least-squares fit; Huber (robust) and Theil-Sen (rank-based) resist being dragged by outliers in the history.
LOO outlier screeningDefault: OffLeave-one-out screening drops history periods wildly inconsistent with the rest — a past incident, a one-off promotion — so they cannot move the baseline or widen the band.
Regression only, and needs at least 6 baseline periods. Turning this on creates a new pattern when you save an existing one — see Manage patterns.
Bound sizeDefault: 2The band's width, in units of the residual spread. 2 gives a ±2-standard-deviation band. 0 disables the band, so every deviation counts.
Fire alert when
Band-crossing alone is often too noisy. These rules are the materiality gate: a detection is only reported if it also satisfies every rule listed here.
Each rule reads as a sentence — metric, measure, comparison, value. In the screenshot above, two rules are combined:
Recovery Campaign Reach·Deviation %·Drop by·is at least·5Recovery Campaign Reach·Baseline value·is greater than·74
The first sets a floor on how big the drop must be. The second is a volume floor — it stops tiny segments, where a handful of events swings the percentage wildly, from generating alerts. Use Add Rule to add more.
The green Detect line summarises the whole rule in plain language.
3. Schedule
When the pattern runs, and which slice of data each run looks at.
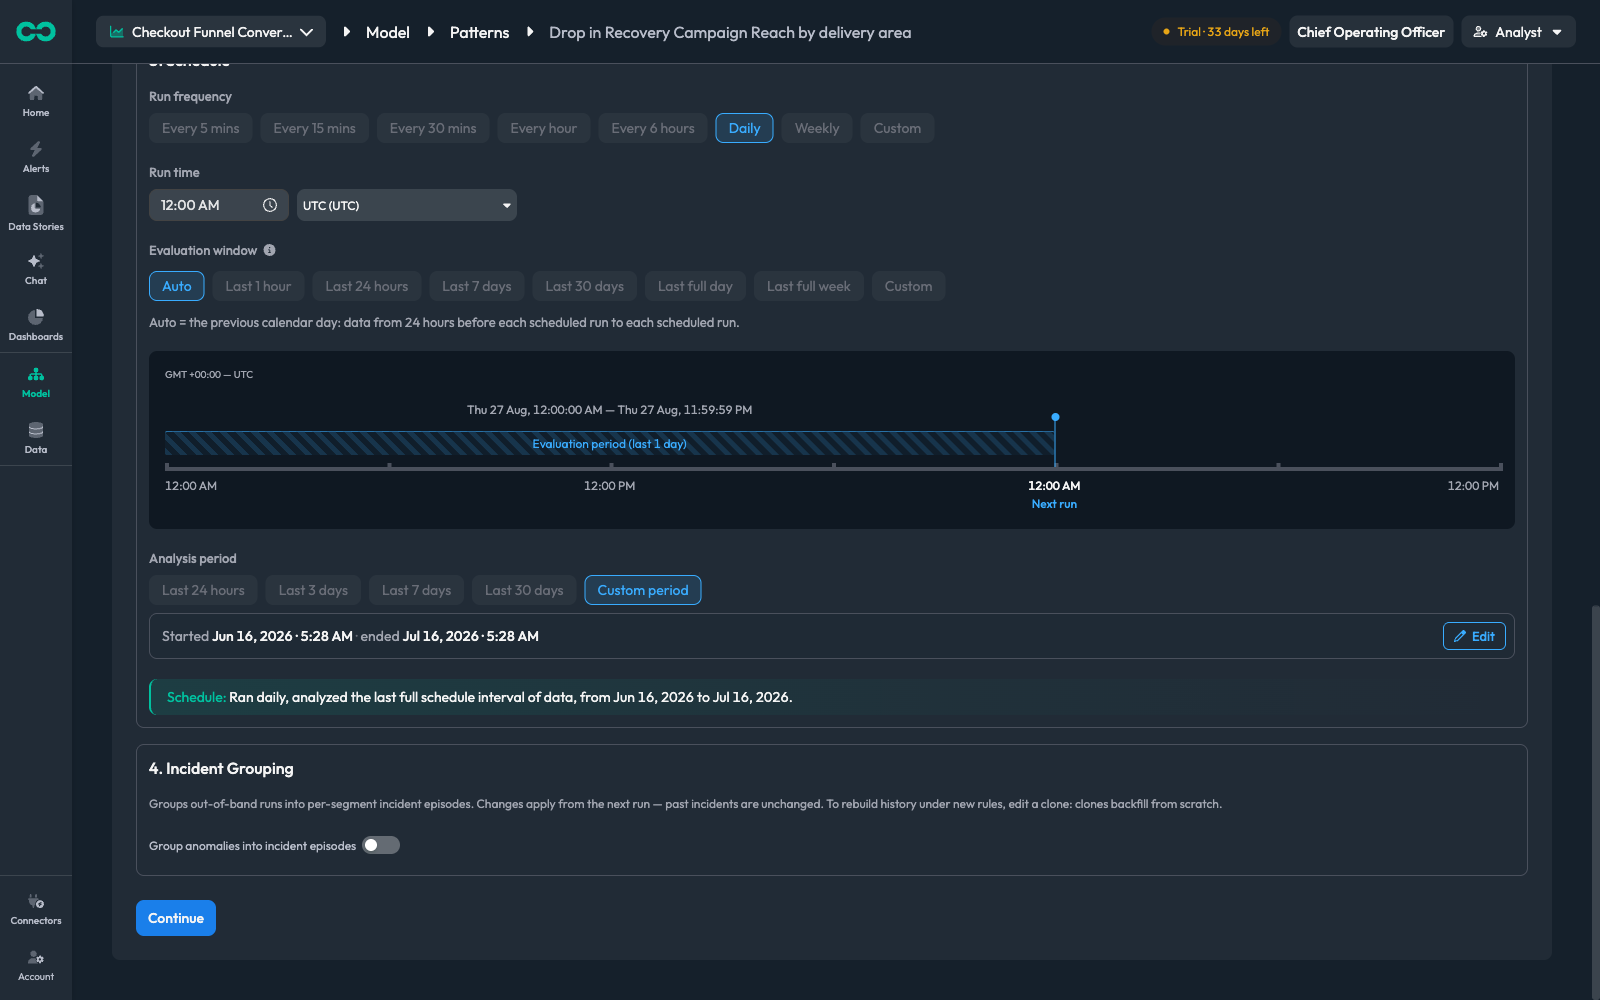
Run frequencyRequiredDefault: DailyHow often the pattern fires: every 5 / 15 / 30 minutes, hourly, every 6 hours, daily, weekly, or a Custom cron expression.
Run timeThe time of day and timezone for daily and weekly schedules.
Evaluation windowDefault: AutoWhich data each run evaluates. Auto means the previous calendar day — data from 24 hours before each scheduled run up to that run. The other presets pin a fixed lookback, and Custom takes explicit bounds.
The timeline below the picker draws the chosen window against the next run, which is the quickest way to spot a window that does not line up with the schedule.
Analysis periodThe overall span the pattern analyses — last 24 hours, 3 / 7 / 30 days, or a Custom period with explicit start and end dates.
4. Incident grouping
Off by default. Turn it on to group consecutive out-of-band runs for the same segment into a single incident episode, rather than emitting a separate finding each run.
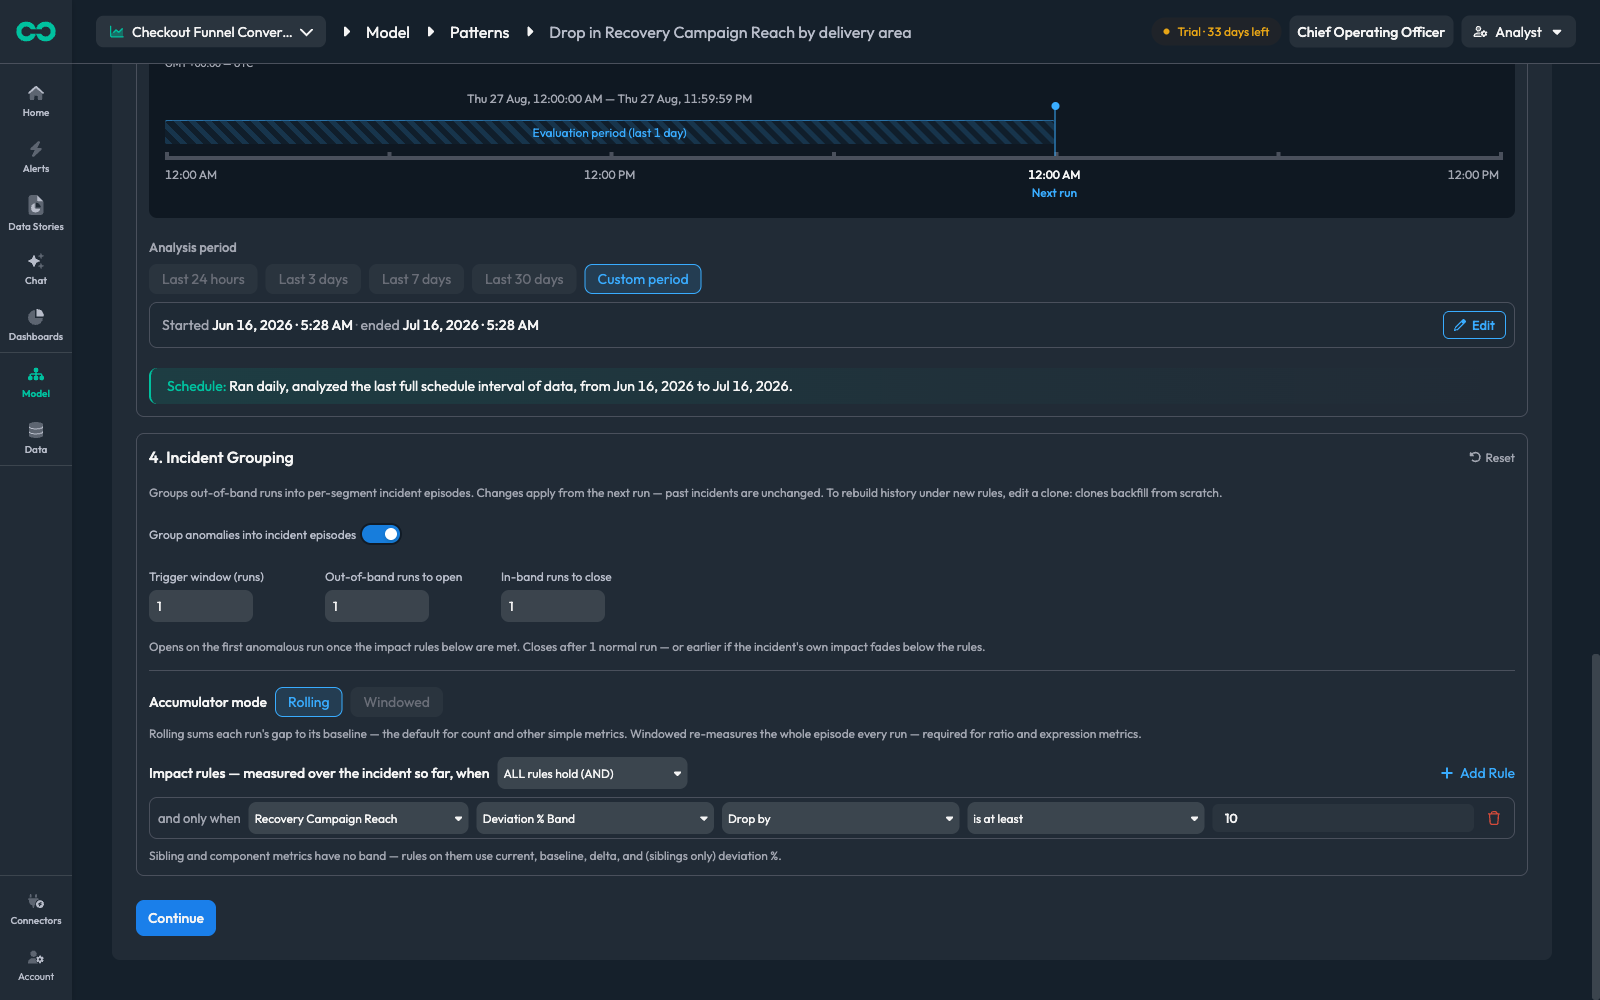
Trigger window (runs)Default: 1How many recent runs are considered when deciding whether to open an incident.
Out-of-band runs to openDefault: 1How many of those runs must be out of band before the incident opens.
In-band runs to closeDefault: 1How many consecutive normal runs close it again.
Accumulator modeDefault: RollingHow the episode's impact is measured. Rolling sums each run's gap to its baseline — the default, and right for counts and other simple metrics. Windowed re-measures the whole episode every run, which is required for ratio and expression metrics.
Impact rulesThe materiality gate for the incident as a whole, measured over the episode so far rather than a single run. Combine them with ALL rules hold (AND) or ANY rule holds (OR).
Editing incident grouping applies from the next run — past incidents are unchanged, and live incidents are closed and reopened under the new rules. To rebuild history under new rules, edit a clone: clones backfill from scratch.
Save
Click Create. The pattern begins running on its schedule immediately, whether it is live or draft.
Next: Explain & Act — telling Bicycle how to investigate what this pattern finds.