Pattern Engine overview
A pattern is a standing question Bicycle asks of your data on a schedule: "has this KPI moved away from what we expected, anywhere that matters?"
Every time a pattern runs it compares the KPI's current value against a baseline built from its own history. Values outside the expected band are anomalies. Anomalies get investigated, grouped into incidents, and delivered to the people who need them.
Patterns live under Model → Patterns, scoped to one use case.
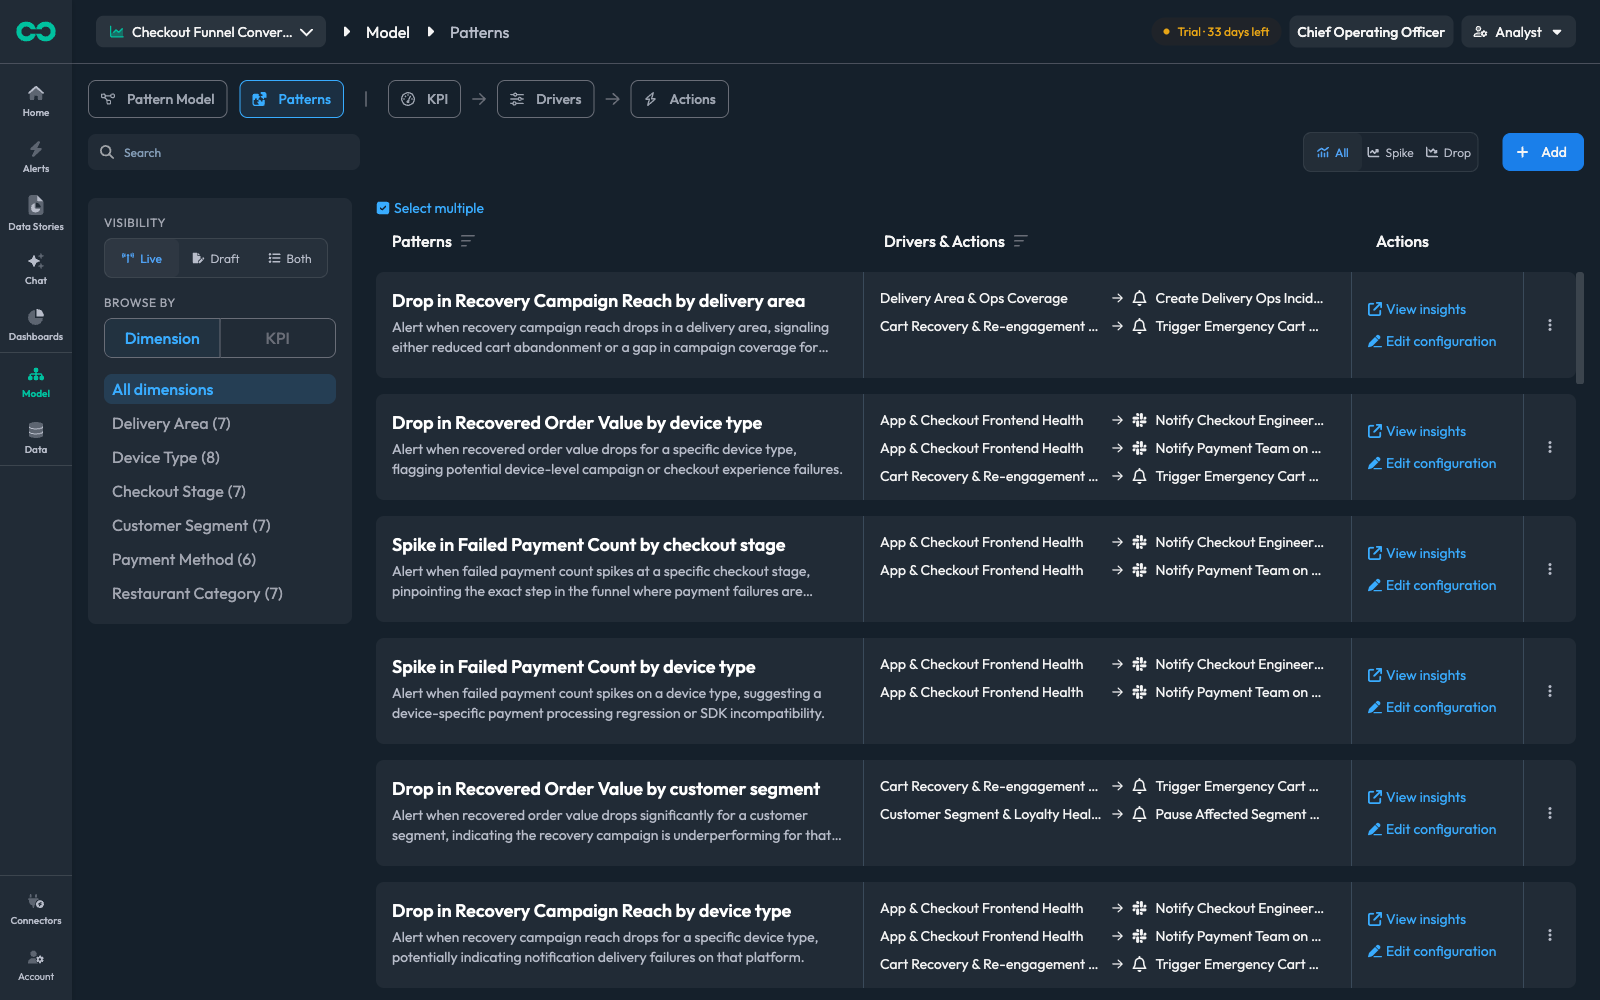
The three parts of a pattern
Every pattern is built from the same three stages. The Pattern Recipe card at the top of any pattern summarises all three in one line each.
Detect
What to watch and how to judge it: the KPI, the dimensions to slice by, the baseline to compare against, how far off counts as an anomaly, and how often to check.
Explain & Act
What happens once something is detected: which dimensions to slice for root-cause analysis, the prompt that guides the investigation, and the drivers whose actions should fire.
Subscribe
Who hears about it, where, and in how much detail — Slack, Teams, or email.
Core concepts
KPIThe metric the pattern tracks — for example Recovery Campaign Reach. One pattern watches one KPI.
DimensionsThe segments the KPI is broken down by, such as Delivery Area or Device Type. A pattern evaluates every segment separately, so a drop in one city is caught even when the overall number looks healthy.
BaselineThe expected value, computed from the KPI's own recent history. You choose how many past periods to use, whether they are matched hourly, daily, or weekly, and how to combine them.
BandThe tolerance around the baseline. Values inside the band are normal; values outside it are out-of-band. Band width is set by Bound size — for example 2 for a ±2-standard-deviation band. Setting it to 0 disables the band.
AnomalyA single out-of-band reading for one segment on one run, in the direction the pattern watches.
IncidentAn episode grouping consecutive out-of-band runs for the same segment, so one sustained problem reads as one thing rather than a stream of separate alerts. Optional — see Incident grouping.
DriverA named cause the pattern can investigate, carrying the actions that should fire — creating a ticket, notifying a team, triggering a campaign. See Explain & Act.
SubscriptionA delivery rule: which alerts go to which channel, with how much detail. See Alerts and subscriptions.
Reading a pattern
Opening a pattern from the list shows a read-only summary of its whole configuration, with the same tabs used for editing.
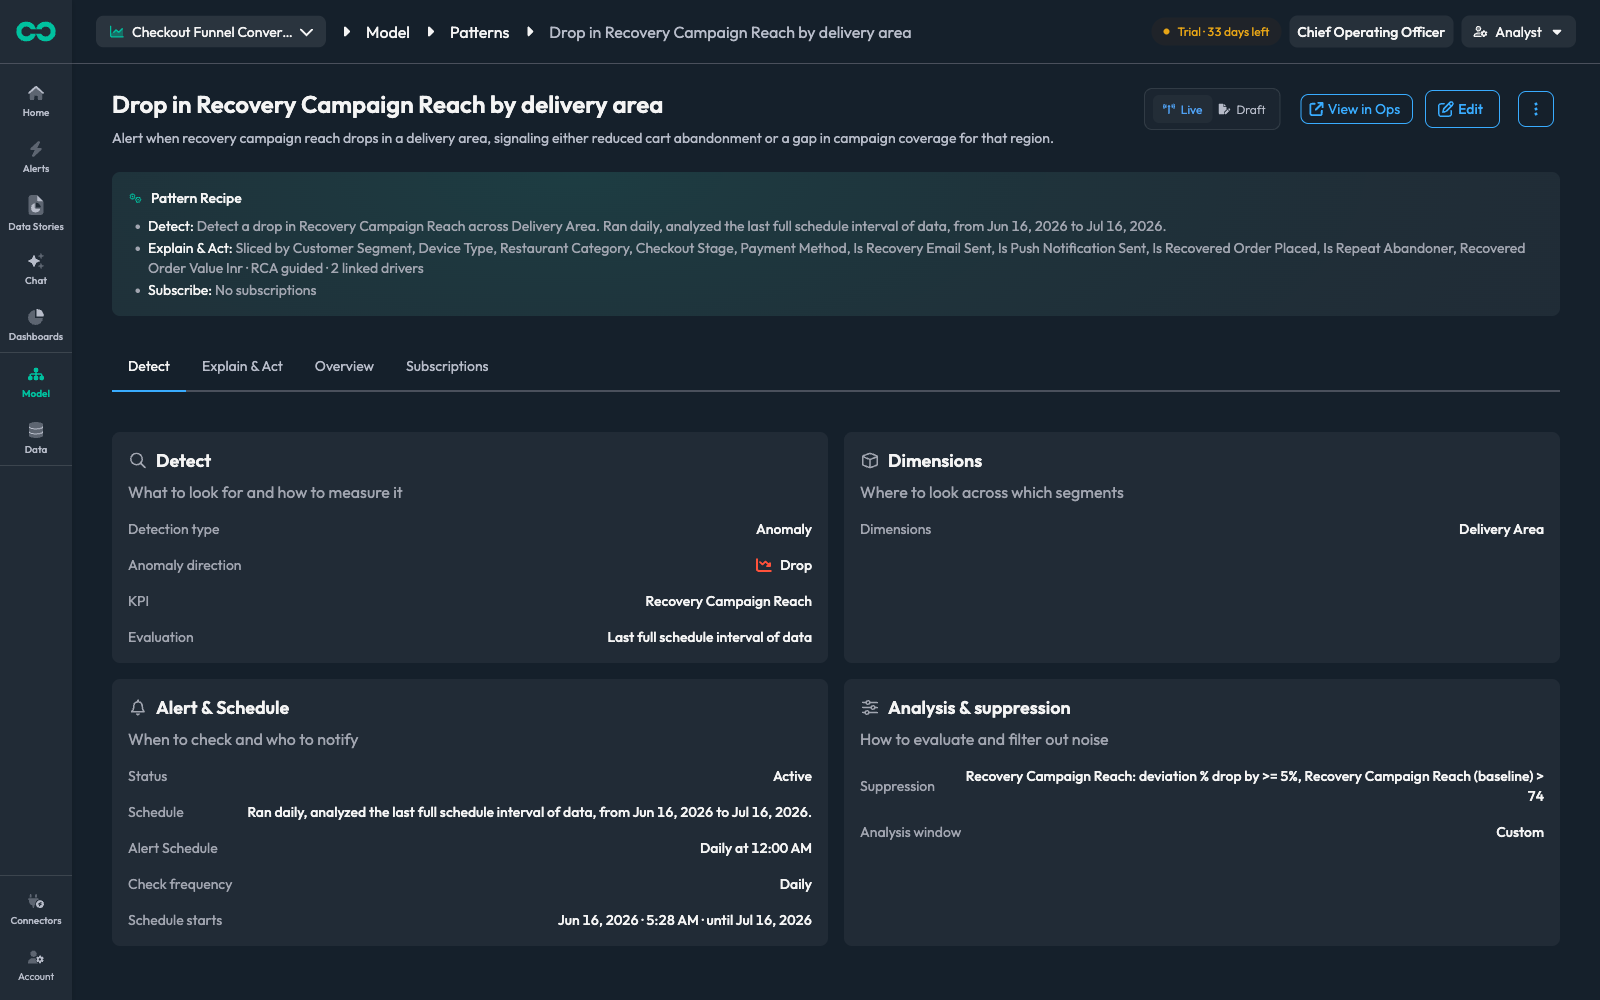
The Detect tab answers four questions at a glance:
| Card | What it tells you |
|---|---|
| Detect | The detection type, the direction watched, the KPI, and the evaluation window |
| Dimensions | Which segments the KPI is sliced by |
| Alert & Schedule | Whether the pattern is active, how often it runs, and when it next fires |
| Analysis & suppression | The rules that decide which detections are material enough to report |
Live and draft
Every pattern is either live or draft, shown as a toggle in the pattern header and as a filter on the list.
A draft pattern is not a paused one. It still runs on schedule, still detects, and still opens and closes incidents. The only difference is that its findings are withheld from the alert feed and the inbox. Draft is how you validate a pattern against real data — a clone under test, a config being tuned, one awaiting sign-off — without it reaching anyone.
Marking a pattern live also reveals every alert it detected while drafted, backdated to when it happened. A pattern that ran drafted for weeks will surface weeks of alerts at once.
Where to go next
- Create a pattern — the Detect tab, field by field
- Explain & Act — root-cause analysis and linked drivers
- Alerts and subscriptions — reviewing results and routing them
- Manage patterns — editing, cloning, pausing, and the pattern lifecycle